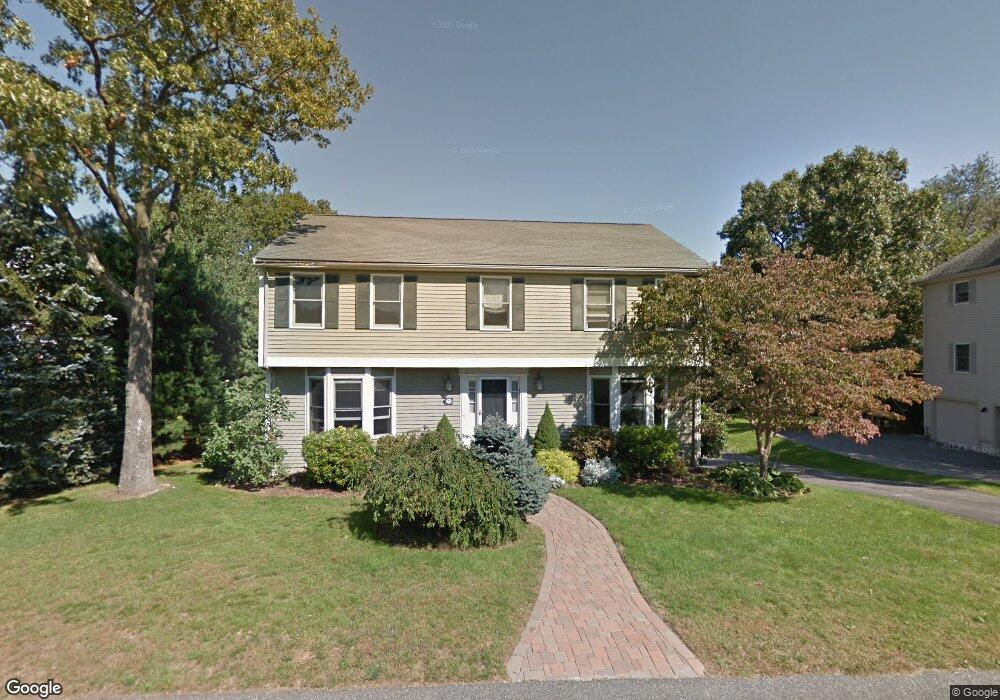
73 Cynthia Rd Unit 73 Needham Heights, MA 02494
Estimated Value: $1,921,000 - $2,065,000
4
Beds
4
Baths
3,040
Sq Ft
$650/Sq Ft
Est. Value
About This Home
This home is located at 73 Cynthia Rd Unit 73, Needham Heights, MA 02494 and is currently estimated at $1,977,092, approximately $650 per square foot. 73 Cynthia Rd Unit 73 is a home located in Norfolk County with nearby schools including Sunita L. Williams Elementary School, High Rock Middle School, and Pollard Middle School.
Ownership History
Date
Name
Owned For
Owner Type
Purchase Details
Closed on
Feb 6, 2009
Sold by
Rubin Amy H and Sostek Amy H
Bought by
Rubin Amy H and Sostek Amy H
Current Estimated Value
Purchase Details
Closed on
Jun 26, 1991
Sold by
Wildale Corp
Bought by
Sostek Donald J
Home Financials for this Owner
Home Financials are based on the most recent Mortgage that was taken out on this home.
Original Mortgage
$200,000
Interest Rate
9.44%
Mortgage Type
Purchase Money Mortgage
Create a Home Valuation Report for This Property
The Home Valuation Report is an in-depth analysis detailing your home's value as well as a comparison with similar homes in the area
Home Values in the Area
Average Home Value in this Area
Purchase History
| Date | Buyer | Sale Price | Title Company |
|---|---|---|---|
| Rubin Amy H | -- | -- | |
| Rubin Amy H | -- | -- | |
| Sostek Donald J | $363,000 | -- | |
| Sostek Donald J | $363,000 | -- |
Source: Public Records
Mortgage History
| Date | Status | Borrower | Loan Amount |
|---|---|---|---|
| Previous Owner | Sostek Donald J | $198,000 | |
| Previous Owner | Sostek Donald J | $202,300 | |
| Previous Owner | Sostek Donald J | $200,000 |
Source: Public Records
Tax History
| Year | Tax Paid | Tax Assessment Tax Assessment Total Assessment is a certain percentage of the fair market value that is determined by local assessors to be the total taxable value of land and additions on the property. | Land | Improvement |
|---|---|---|---|---|
| 2025 | $18,081 | $1,705,800 | $757,900 | $947,900 |
| 2024 | $18,860 | $1,506,400 | $502,600 | $1,003,800 |
| 2023 | $18,495 | $1,418,300 | $502,600 | $915,700 |
| 2022 | $15,580 | $1,165,300 | $453,900 | $711,400 |
| 2021 | $12,346 | $947,500 | $453,900 | $493,600 |
| 2020 | $12,309 | $985,500 | $453,900 | $531,600 |
| 2019 | $11,581 | $934,700 | $413,700 | $521,000 |
| 2018 | $11,104 | $934,700 | $413,700 | $521,000 |
| 2017 | $10,357 | $871,100 | $413,700 | $457,400 |
| 2016 | $10,052 | $871,100 | $413,700 | $457,400 |
| 2015 | $9,835 | $871,100 | $413,700 | $457,400 |
| 2014 | $9,501 | $816,200 | $377,100 | $439,100 |
Source: Public Records
Map
Nearby Homes
- 12 Hill St
- 98 Hunnewell St
- 443 Central Ave
- 379 Hunnewell St Unit 379
- 140 Hillside Ave
- 140 Hillside Ave Unit a
- 400 Hunnewell St Unit 103
- 132 Hillside Ave
- 11 Shirley Rd
- 34 Pershing Rd
- 3 Crescent Rd
- 345 Central Ave
- 445 Hillside Ave
- 100 Rosemary Way Unit 129
- 100 Rosemary Way Unit 324
- 310 Oakland St
- 62 Evelyn Rd
- 74 Gary Rd
- 5 Homsy Ln
- 40 High St