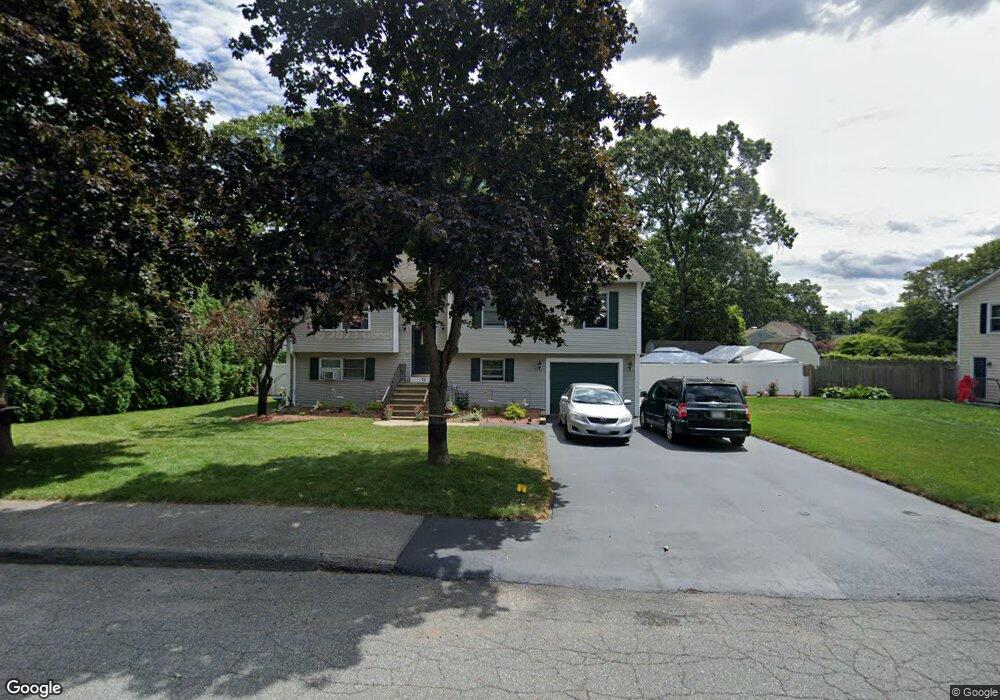
73 Daniels Rd Marlborough, MA 01752
Estimated Value: $574,000 - $659,000
3
Beds
3
Baths
1,328
Sq Ft
$463/Sq Ft
Est. Value
About This Home
This home is located at 73 Daniels Rd, Marlborough, MA 01752 and is currently estimated at $615,290, approximately $463 per square foot. 73 Daniels Rd is a home located in Middlesex County with nearby schools including Marlborough High School and Darnell School For Educational & Behavioral Service.
Ownership History
Date
Name
Owned For
Owner Type
Purchase Details
Closed on
Nov 10, 1994
Sold by
Tynan John D and Tynan Jacqueline A
Bought by
Dirusso Timothy
Current Estimated Value
Purchase Details
Closed on
Mar 25, 1991
Sold by
Carruth Capital Corp
Bought by
Tynan John D and Tynan Jacqueline A
Home Financials for this Owner
Home Financials are based on the most recent Mortgage that was taken out on this home.
Original Mortgage
$119,700
Interest Rate
9.27%
Mortgage Type
Purchase Money Mortgage
Create a Home Valuation Report for This Property
The Home Valuation Report is an in-depth analysis detailing your home's value as well as a comparison with similar homes in the area
Home Values in the Area
Average Home Value in this Area
Purchase History
| Date | Buyer | Sale Price | Title Company |
|---|---|---|---|
| Dirusso Timothy | $126,600 | -- | |
| Tynan John D | $117,500 | -- |
Source: Public Records
Mortgage History
| Date | Status | Borrower | Loan Amount |
|---|---|---|---|
| Open | Tynan John D | $140,000 | |
| Closed | Tynan John D | $25,000 | |
| Previous Owner | Tynan John D | $122,600 | |
| Previous Owner | Tynan John D | $119,700 |
Source: Public Records
Tax History Compared to Growth
Tax History
| Year | Tax Paid | Tax Assessment Tax Assessment Total Assessment is a certain percentage of the fair market value that is determined by local assessors to be the total taxable value of land and additions on the property. | Land | Improvement |
|---|---|---|---|---|
| 2025 | $5,546 | $562,500 | $223,500 | $339,000 |
| 2024 | $5,428 | $530,100 | $203,100 | $327,000 |
| 2023 | $5,765 | $499,600 | $173,000 | $326,600 |
| 2022 | $5,572 | $424,700 | $164,800 | $259,900 |
| 2021 | $14,021 | $389,300 | $137,300 | $252,000 |
| 2020 | $5,269 | $371,600 | $130,800 | $240,800 |
| 2019 | $5,138 | $365,200 | $128,100 | $237,100 |
| 2018 | $5,204 | $355,700 | $105,500 | $250,200 |
| 2017 | $5,215 | $340,400 | $103,800 | $236,600 |
| 2016 | $5,120 | $333,800 | $103,800 | $230,000 |
| 2015 | $4,512 | $286,300 | $106,500 | $179,800 |
Source: Public Records
Map
Nearby Homes
- 48 Jewell Rd Unit Lot 6
- 46 Jewell Rd Unit Lot 5
- 44 Jewell Rd Unit Lot 4
- 30 Jewell Rd Unit Lot 2
- 36 Jewell Rd Unit Lot 3
- 129 Fort Meadow Dr
- 18 Collins Dr
- 18 Amory Rd
- 57 Paquin Dr
- 1 Rotherham Way Unit B
- 114 Lodi Rd
- 377 Hosmer St
- 2 Blueberry Ln
- 656 Bolton St
- 8 Abigail Dr
- 132 Hosmer St
- 45 Raffaele Rd
- 9 & 9A Abigail
- 0 Washington St
- 38 Airport Blvd