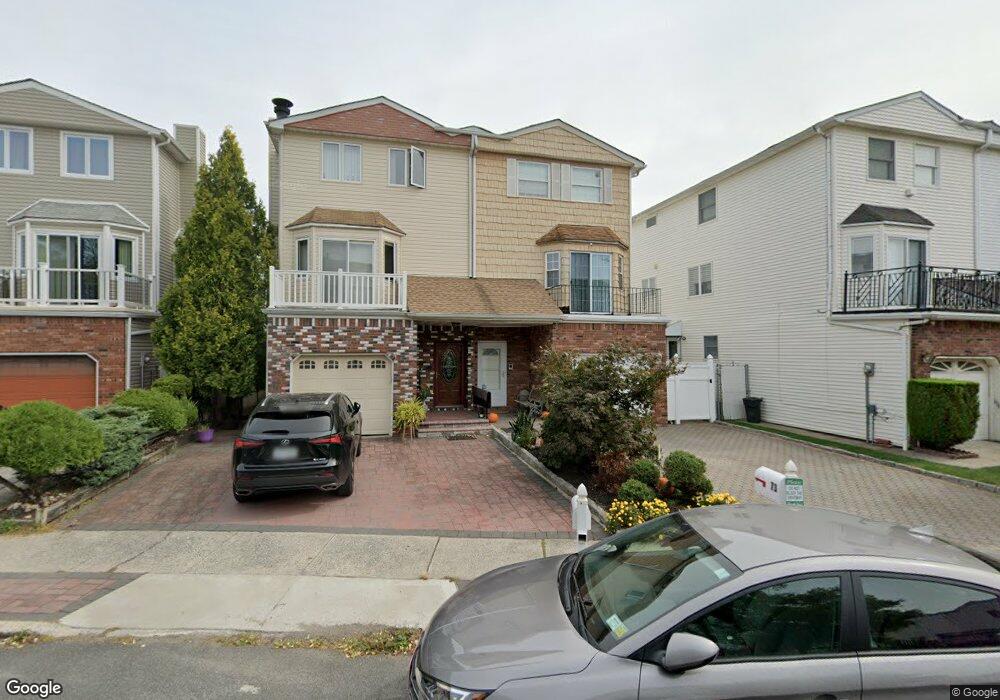
73 Dina Ct Staten Island, NY 10306
Great Kills NeighborhoodEstimated Value: $786,607 - $1,011,000
--
Bed
4
Baths
1,872
Sq Ft
$469/Sq Ft
Est. Value
About This Home
This home is located at 73 Dina Ct, Staten Island, NY 10306 and is currently estimated at $878,152, approximately $469 per square foot. 73 Dina Ct is a home located in Richmond County with nearby schools including P.S. 50 Frank Hankinson School, Myra S. Barnes Intermediate School 24, and Susan E Wagner High School.
Ownership History
Date
Name
Owned For
Owner Type
Purchase Details
Closed on
Dec 27, 2000
Sold by
Verra John
Bought by
Cannizzaro Louis and Cannizzaro Toni Ann
Current Estimated Value
Purchase Details
Closed on
Feb 14, 1997
Sold by
Donato Fred and Donato Rose
Bought by
Cannizzaro Louis and Cannizzaro Toni Ann
Home Financials for this Owner
Home Financials are based on the most recent Mortgage that was taken out on this home.
Original Mortgage
$180,000
Interest Rate
7.78%
Create a Home Valuation Report for This Property
The Home Valuation Report is an in-depth analysis detailing your home's value as well as a comparison with similar homes in the area
Home Values in the Area
Average Home Value in this Area
Purchase History
| Date | Buyer | Sale Price | Title Company |
|---|---|---|---|
| Cannizzaro Louis | -- | -- | |
| Cannizzaro Louis | $225,000 | -- |
Source: Public Records
Mortgage History
| Date | Status | Borrower | Loan Amount |
|---|---|---|---|
| Previous Owner | Cannizzaro Louis | $180,000 |
Source: Public Records
Tax History Compared to Growth
Tax History
| Year | Tax Paid | Tax Assessment Tax Assessment Total Assessment is a certain percentage of the fair market value that is determined by local assessors to be the total taxable value of land and additions on the property. | Land | Improvement |
|---|---|---|---|---|
| 2025 | $7,597 | $51,600 | $7,542 | $44,058 |
| 2024 | $7,609 | $42,540 | $8,631 | $33,909 |
| 2023 | $7,355 | $38,020 | $8,401 | $29,619 |
| 2022 | $7,303 | $42,540 | $9,360 | $33,180 |
| 2021 | $7,426 | $41,400 | $9,360 | $32,040 |
| 2020 | $7,038 | $40,200 | $9,360 | $30,840 |
| 2019 | $6,545 | $37,020 | $9,360 | $27,660 |
| 2018 | $6,161 | $31,683 | $7,500 | $24,183 |
| 2017 | $6,159 | $31,683 | $8,251 | $23,432 |
| 2016 | $5,809 | $30,606 | $8,189 | $22,417 |
| 2015 | $4,923 | $28,874 | $6,887 | $21,987 |
| 2014 | $4,923 | $27,240 | $7,800 | $19,440 |
Source: Public Records
Map
Nearby Homes