
73 Division St West Harwich, MA 02671
Northwest Harwich NeighborhoodEstimated payment $4,308/month
Highlights
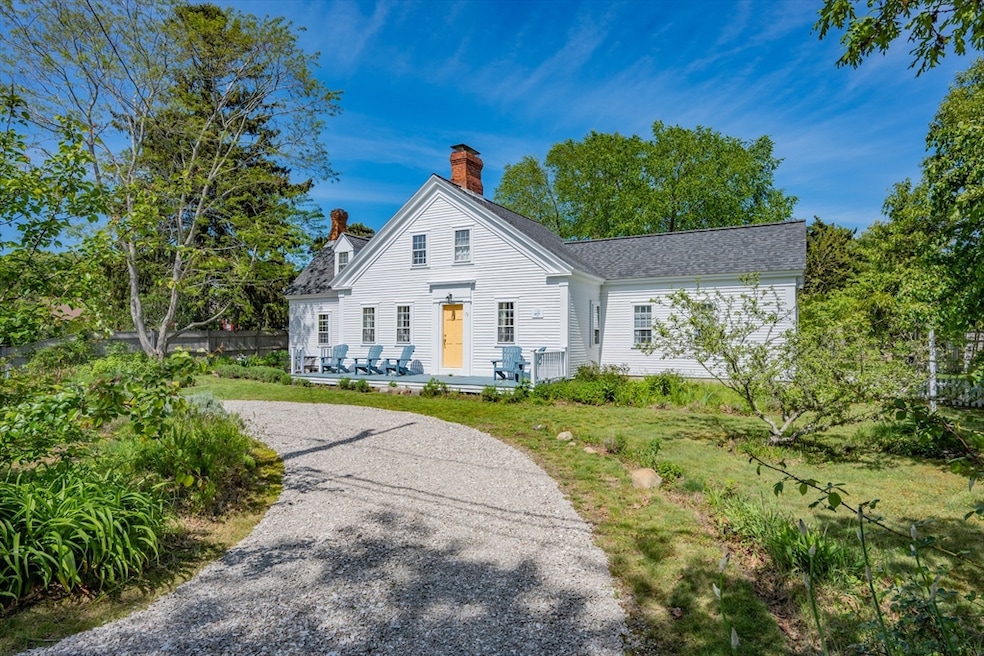
- Cape Cod Architecture
- Wood Flooring
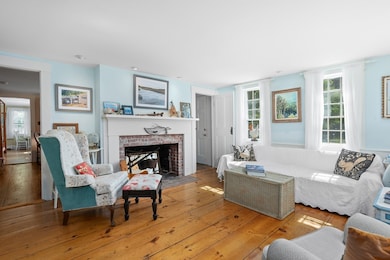
- 3 Fireplaces
- Chatham Elementary School Rated A-
- Main Floor Primary Bedroom
- 3-minute walk to Dennis Port Village Green
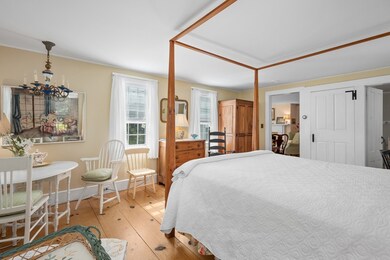
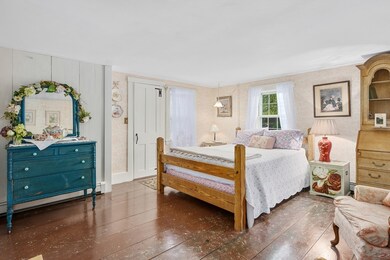
About This Home
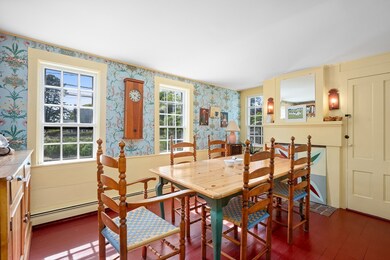
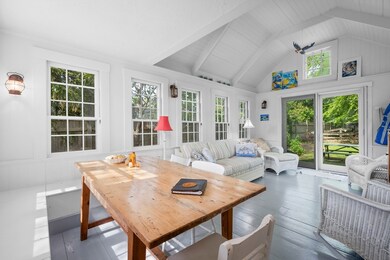
Picture perfect home that beautifully marries the allure of yesteryear with today's conveniences. This meticulously restored residence offers a harmonious blend of historical charm and modern living. With 5 bedrooms, including two first-floor ensuite bedrooms, there is plenty of space for family and guests, while three additional bedrooms upstairs provide further. Charm exudes throughout every room in this home. Delight in the thoughtful details, from wide plank wood floors, wood panel doors to vintage claw foot tubs, adding unique character to the space. The abundance of living areas includes a formal living room, a separate sitting room, and an expansive sunroom that invites you to bask in natural light. This sunroom opens up to a picturesque backyard, lush with mature plantings, perfect for outdoor gatherings or peaceful relaxation. The residence also features a beautifully restored oven, seamlessly integrating modern conveniences with historical charm, making it a truly unique home
Home Details
Home Type
- Single Family
Est. Annual Taxes
- $4,556
Year Built
- Built in 1850
Lot Details
- 10,545 Sq Ft Lot
- Level Lot
Parking
- 4 Car Parking Spaces
Home Design
- Cape Cod Architecture
- Frame Construction
- Shingle Roof
Interior Spaces
- 2,281 Sq Ft Home
- 3 Fireplaces
- Wood Flooring
Bedrooms and Bathrooms
- 5 Bedrooms
- Primary Bedroom on Main
Pool
- Outdoor Shower
Utilities
- No Cooling
- Baseboard Heating
- Water Heater
- Private Sewer
Community Details
- No Home Owners Association
Listing and Financial Details
- Assessor Parcel Number 2329181
Map
Home Values in the Area
Average Home Value in this Area
Tax History
| Year | Tax Paid | Tax Assessment Tax Assessment Total Assessment is a certain percentage of the fair market value that is determined by local assessors to be the total taxable value of land and additions on the property. | Land | Improvement |
|---|---|---|---|---|
| 2025 | $4,556 | $770,900 | $299,900 | $471,000 |
| 2024 | $4,421 | $733,100 | $282,900 | $450,200 |
| 2023 | $4,257 | $641,100 | $257,200 | $383,900 |
| 2022 | $4,070 | $501,800 | $208,800 | $293,000 |
| 2021 | $4,027 | $468,300 | $189,800 | $278,500 |
| 2020 | $3,837 | $439,500 | $168,900 | $270,600 |
| 2019 | $3,748 | $432,300 | $161,100 | $271,200 |
| 2018 | $3,655 | $403,200 | $146,400 | $256,800 |
| 2017 | $3,436 | $383,000 | $133,500 | $249,500 |
| 2016 | $3,352 | $369,600 | $133,500 | $236,100 |
| 2015 | $3,256 | $363,000 | $130,800 | $232,200 |
| 2014 | $3,092 | $352,600 | $126,900 | $225,700 |
Property History
| Date | Event | Price | List to Sale | Price per Sq Ft | Prior Sale |
|---|---|---|---|---|---|
| 12/05/2025 12/05/25 | Sold | $730,000 | -2.5% | $320 / Sq Ft | View Prior Sale |
| 11/02/2025 11/02/25 | Pending | -- | -- | -- | |
| 10/17/2025 10/17/25 | Price Changed | $749,000 | -6.3% | $328 / Sq Ft | |
| 09/14/2025 09/14/25 | Price Changed | $799,000 | -5.9% | $350 / Sq Ft | |
| 08/05/2025 08/05/25 | Price Changed | $849,000 | -5.6% | $372 / Sq Ft | |
| 06/16/2025 06/16/25 | For Sale | $899,000 | -- | $394 / Sq Ft |
Purchase History
| Date | Type | Sale Price | Title Company |
|---|---|---|---|
| Leasehold Conv With Agreement Of Sale Fee Purchase Hawaii | $170,000 | -- |
Mortgage History
| Date | Status | Loan Amount | Loan Type |
|---|---|---|---|
| Open | $153,000 | Purchase Money Mortgage |
Source: MLS Property Information Network (MLS PIN)
MLS Number: 73415526
APN: HARW-000003-000000-C000006-000005
Disclaimer: Certain information contained herein is derived from information provided by parties other than Homes.com. All information provided is deemed reliable, but is not guaranteed to be accurate and should be independently verified.
![]() The property listing data and information, or the Images, set forth herein were provided to MLS Property Information Network, Inc. from third party sources, including sellers, lessors and public records, and were compiled by MLS Property Information Network, Inc. The property listing data and information, and the Images, are for the personal, non-commercial use of consumers having a good faith interest in purchasing or leasing listed properties of the type displayed to them and may not be used for any purpose other than to identify prospective properties which such consumers may have a good faith interest in purchasing or leasing. MLS Property Information Network, Inc. and its subscribers disclaim any and all representations and warranties as to the accuracy of the property listing data and information, or as to the accuracy of any of the Images, set forth herein.
The property listing data and information, or the Images, set forth herein were provided to MLS Property Information Network, Inc. from third party sources, including sellers, lessors and public records, and were compiled by MLS Property Information Network, Inc. The property listing data and information, and the Images, are for the personal, non-commercial use of consumers having a good faith interest in purchasing or leasing listed properties of the type displayed to them and may not be used for any purpose other than to identify prospective properties which such consumers may have a good faith interest in purchasing or leasing. MLS Property Information Network, Inc. and its subscribers disclaim any and all representations and warranties as to the accuracy of the property listing data and information, or as to the accuracy of any of the Images, set forth herein.
- 148 Belmont Rd
- 45 Route 28
- 141 Division St
- 141 Division St
- 79 Massachusetts 28
- 47 Telegraph Rd Unit 1
- 3 Fairbanks Dr
- 12 Cross St
- 6 Bayberry Ln
- 9 Bells Neck Rd Unit 10
- 9 Mansion St
- 9 Country Ln
- 10 Candlewood Ln Unit 2-1
- 12 Candlewood Ln Unit 2-9
- 12 Candlewood Ln Unit 1-6
- 126 Massachusetts 28
- 1 Belmont Rd Unit 630
- 24 Chase St
- 64 Smith St
- 104 Toms Path
