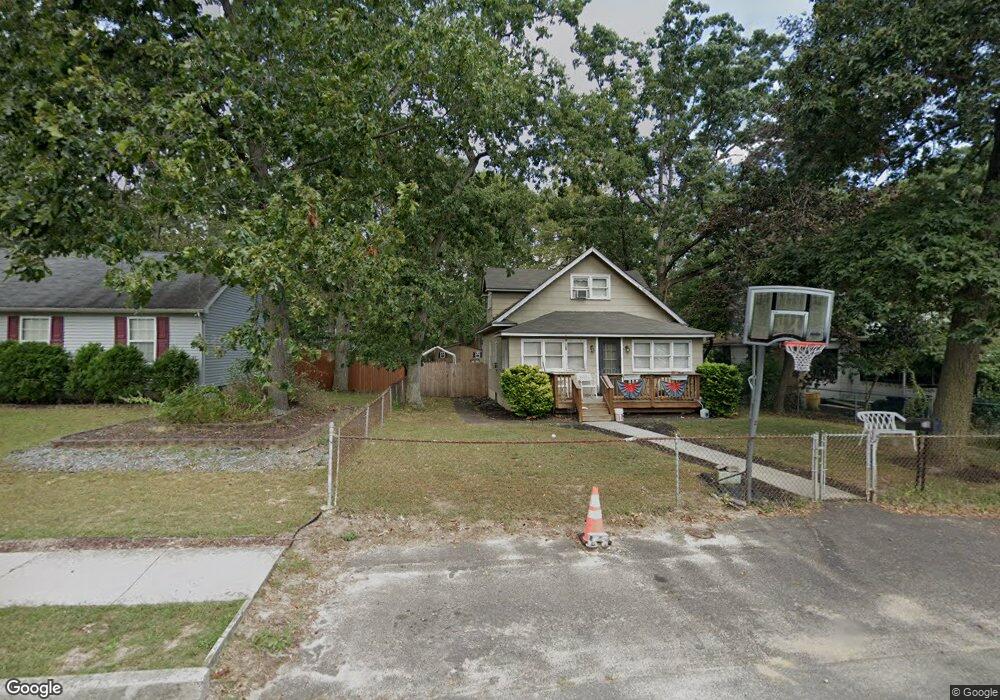
73 E Clearview Ave Pine Hill, NJ 08021
Estimated Value: $252,897 - $299,000
Studio
--
Bath
1,344
Sq Ft
$205/Sq Ft
Est. Value
About This Home
This home is located at 73 E Clearview Ave, Pine Hill, NJ 08021 and is currently estimated at $275,474, approximately $204 per square foot. 73 E Clearview Ave is a home located in Camden County with nearby schools including Albert M. Bean Elementary School, Pine Hill Middle School, and Overbrook High School.
Ownership History
Date
Name
Owned For
Owner Type
Purchase Details
Closed on
Nov 1, 2016
Sold by
Burkhart Michele Bribbin
Bought by
Harvey James A
Current Estimated Value
Purchase Details
Closed on
Nov 27, 2004
Sold by
Crumley Charles
Bought by
Harvey James and Gribbin Michele
Home Financials for this Owner
Home Financials are based on the most recent Mortgage that was taken out on this home.
Original Mortgage
$101,600
Interest Rate
5.81%
Purchase Details
Closed on
May 24, 2002
Sold by
Crumley Linda
Bought by
Charles Crumley
Home Financials for this Owner
Home Financials are based on the most recent Mortgage that was taken out on this home.
Original Mortgage
$85,500
Interest Rate
6.92%
Purchase Details
Closed on
May 26, 2000
Sold by
Estate Of Edward C Ferrell
Bought by
Crumley Linda
Home Financials for this Owner
Home Financials are based on the most recent Mortgage that was taken out on this home.
Original Mortgage
$75,450
Interest Rate
8.12%
Mortgage Type
FHA
Create a Home Valuation Report for This Property
The Home Valuation Report is an in-depth analysis detailing your home's value as well as a comparison with similar homes in the area
Home Values in the Area
Average Home Value in this Area
Purchase History
| Date | Buyer | Sale Price | Title Company |
|---|---|---|---|
| Harvey James A | -- | None Available | |
| Harvey James | $127,000 | -- | |
| Charles Crumley | $95,000 | -- | |
| Crumley Linda | $75,500 | -- |
Source: Public Records
Mortgage History
| Date | Status | Borrower | Loan Amount |
|---|---|---|---|
| Previous Owner | Harvey James | $101,600 | |
| Previous Owner | Charles Crumley | $85,500 | |
| Previous Owner | Crumley Linda | $75,450 |
Source: Public Records
Tax History
| Year | Tax Paid | Tax Assessment Tax Assessment Total Assessment is a certain percentage of the fair market value that is determined by local assessors to be the total taxable value of land and additions on the property. | Land | Improvement |
|---|---|---|---|---|
| 2025 | $6,111 | $108,400 | $20,000 | $88,400 |
| 2024 | $5,899 | $108,400 | $20,000 | $88,400 |
| 2023 | $5,899 | $108,400 | $20,000 | $88,400 |
| 2022 | $5,730 | $108,400 | $20,000 | $88,400 |
| 2021 | $5,545 | $108,400 | $20,000 | $88,400 |
| 2020 | $5,729 | $108,400 | $20,000 | $88,400 |
| 2019 | $843 | $108,400 | $20,000 | $88,400 |
| 2018 | $5,892 | $108,400 | $20,000 | $88,400 |
| 2017 | $5,766 | $108,400 | $20,000 | $88,400 |
| 2016 | $5,961 | $141,400 | $45,000 | $96,400 |
| 2015 | $5,797 | $141,400 | $45,000 | $96,400 |
| 2014 | $5,631 | $141,400 | $45,000 | $96,400 |
Source: Public Records
Map
Nearby Homes
- 16 E Woodburn Ave
- 15 Spring St
- 1500 Oak St
- 16 E 7th Ave
- 0 W Woodburn Ave
- 1521 Hickstown Rd
- 1604 Erial Rd
- 7 Gristmill Ln
- 166 W Clearview Ave
- 49 Hazeltop Dr
- 503 Bromley Estate
- 44 E 4th Ave
- 607 Bromley Estate
- 90 Shenandoah Dr
- 24 Millstream Rd
- 302 Bromley Estate
- 33 Mac Knight Dr
- 1700 Rd
- 8 Swift Run Dr Unit SW008
- 91 Mount Clement Ave
- 95 E Clearview Ave
- 63 E Clearview Ave
- 77 E Clearview Ave
- 81 E Clearview Ave
- 85 E Clearview Ave
- 66 E Branch Ave
- 78 E Branch Ave
- 59 E Clearview Ave
- 76 E Clearview Ave
- 91 E Clearview Ave
- 64 E Branch Ave
- 66 E Clearview Ave
- 80 E Branch Ave
- 57 E Clearview Ave
- 62 E Clearview Ave
- 119 E Clearview Ave
- 58 E Clearview Ave
- 88 E Clearview Ave
- 56 E Clearview Ave
- 73 E Branch Ave
Your Personal Tour Guide
Ask me questions while you tour the home.