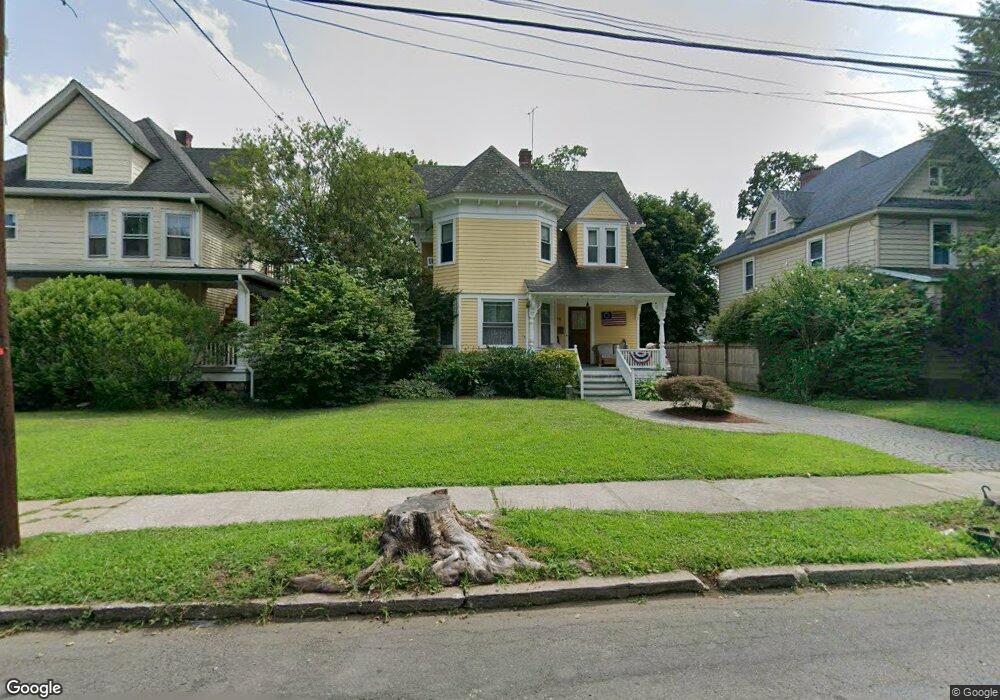
73 E Maple Ave Suffern, NY 10901
Estimated Value: $705,000 - $748,000
5
Beds
1
Bath
2,433
Sq Ft
$300/Sq Ft
Est. Value
About This Home
This home is located at 73 E Maple Ave, Suffern, NY 10901 and is currently estimated at $729,789, approximately $299 per square foot. 73 E Maple Ave is a home located in Rockland County with nearby schools including Suffern Middle School, Suffern High School, and ONESCHOOL GLOBAL-NEW YORK.
Ownership History
Date
Name
Owned For
Owner Type
Purchase Details
Closed on
Jul 17, 2023
Sold by
Jannarone Diane
Bought by
Rooney Christopher and Rooney Kara
Current Estimated Value
Home Financials for this Owner
Home Financials are based on the most recent Mortgage that was taken out on this home.
Original Mortgage
$375,000
Outstanding Balance
$366,054
Interest Rate
6.79%
Mortgage Type
New Conventional
Estimated Equity
$363,735
Purchase Details
Closed on
Jun 2, 2014
Sold by
Jannarone Sam and Jannarone Diane
Bought by
Jannarone Diane
Purchase Details
Closed on
Feb 1, 2006
Sold by
Jannarone Maureen
Bought by
Jannarone Sam and Jannarone Diane
Purchase Details
Closed on
Nov 16, 2004
Sold by
Jannarone Maureen
Bought by
Jannarone Phillip A
Purchase Details
Closed on
Sep 10, 2003
Sold by
Neumann Joseph
Bought by
Garden Plaza Const Enterprises Llc
Create a Home Valuation Report for This Property
The Home Valuation Report is an in-depth analysis detailing your home's value as well as a comparison with similar homes in the area
Home Values in the Area
Average Home Value in this Area
Purchase History
| Date | Buyer | Sale Price | Title Company |
|---|---|---|---|
| Rooney Christopher | $575,000 | Jny | |
| Jannarone Diane | -- | Your Titl Experts | |
| Jannarone Sam | -- | The Judicial Title Insurance | |
| Jannarone Phillip A | -- | -- | |
| Garden Plaza Const Enterprises Llc | $295,000 | Fidelity National Title Insu |
Source: Public Records
Mortgage History
| Date | Status | Borrower | Loan Amount |
|---|---|---|---|
| Open | Rooney Christopher | $375,000 |
Source: Public Records
Tax History
| Year | Tax Paid | Tax Assessment Tax Assessment Total Assessment is a certain percentage of the fair market value that is determined by local assessors to be the total taxable value of land and additions on the property. | Land | Improvement |
|---|---|---|---|---|
| 2024 | $17,146 | $50,000 | $10,300 | $39,700 |
| 2023 | $17,146 | $50,000 | $10,300 | $39,700 |
| 2022 | $17,054 | $50,000 | $10,300 | $39,700 |
| 2021 | $17,054 | $50,000 | $10,300 | $39,700 |
| 2020 | $16,522 | $50,000 | $10,300 | $39,700 |
| 2019 | $15,662 | $50,000 | $10,300 | $39,700 |
| 2018 | $15,662 | $50,000 | $10,300 | $39,700 |
| 2017 | $14,828 | $50,000 | $10,300 | $39,700 |
| 2016 | $14,194 | $50,000 | $10,300 | $39,700 |
| 2015 | -- | $50,000 | $10,300 | $39,700 |
| 2014 | -- | $50,000 | $10,300 | $39,700 |
Source: Public Records
Map
Nearby Homes
- 81 E Maple Ave
- 74 E Maple Ave
- 9 Clinton Place
- 5 Highland Ave
- 102 Washington Ave
- 168 Orange Ave
- 57 Park Ave
- 5 Oakdale Manor Unit B14
- 5 Oakdale Manor Unit L17
- 5 Oakdale Manor Unit L14
- 5 Oakdale Manor Unit B18
- 112 Washington Ave
- 24 E Park Place
- 4 Cedar Ln
- 22 E Park Place
- 47 Prairie Ave
- 25 Rockland Terrace
- 73 Lonergan Dr
- 9 Prospect Place
- 59 Prairie Ave
- 71 E Maple Ave
- 75 E Maple Ave
- 77 E Maple Ave Unit 2
- 77 E Maple Ave Unit 3
- 77 E Maple Ave Unit 2
- 77 E Maple Ave
- 69 E Maple Ave
- 74 E Maltbie Ave
- 72 E Maltbie Ave
- 76 E Maltbie Ave
- 67 E Maple Ave
- 70 E Maltbie Ave
- 79 E Maple Ave
- 72 E Maple Ave
- 68 E Maltbie Ave
- 70 E Maple Ave Unit 2F
- 70 E Maple Ave
- 78 E Maple Ave
- 78 E Maple Ave Unit 1
- 80 E Maple Ave
Your Personal Tour Guide
Ask me questions while you tour the home.