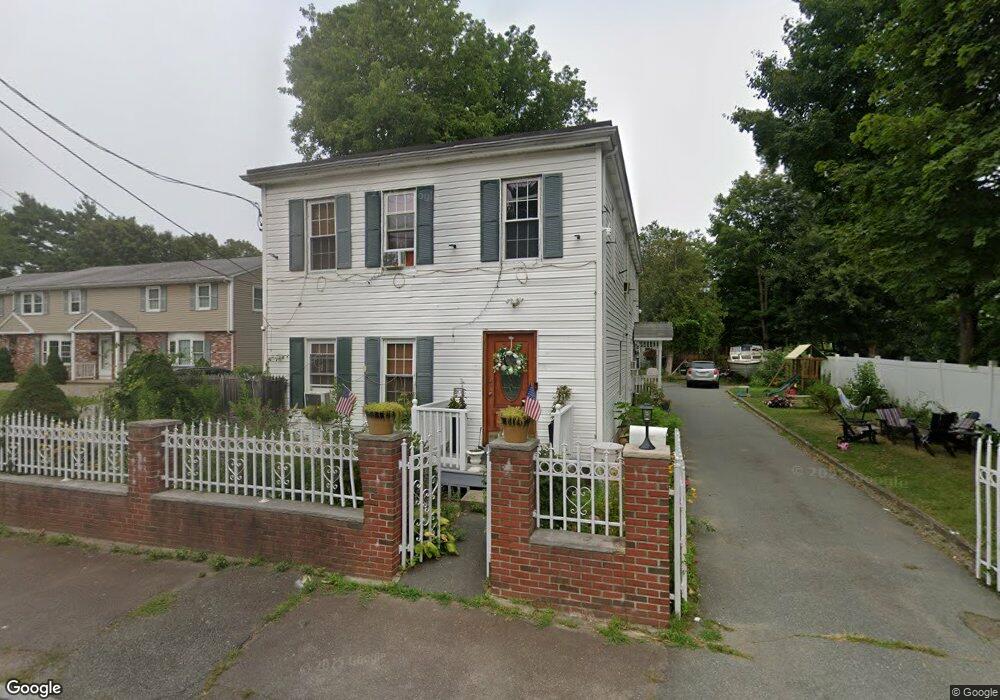
73 Emmet St Brockton, MA 02302
Estimated Value: $575,000 - $735,000
8
Beds
2
Baths
2,404
Sq Ft
$265/Sq Ft
Est. Value
About This Home
This home is located at 73 Emmet St, Brockton, MA 02302 and is currently estimated at $636,329, approximately $264 per square foot. 73 Emmet St is a home located in Plymouth County with nearby schools including Brookfield Elementary School, Mary E. Baker Elementary School, and Downey Elementary School.
Ownership History
Date
Name
Owned For
Owner Type
Purchase Details
Closed on
Mar 17, 1992
Sold by
Fed Natl Mtg Assn
Bought by
Gelven Suzanne C
Current Estimated Value
Home Financials for this Owner
Home Financials are based on the most recent Mortgage that was taken out on this home.
Original Mortgage
$40,000
Interest Rate
8.64%
Mortgage Type
Purchase Money Mortgage
Purchase Details
Closed on
Dec 24, 1991
Sold by
Oliveira Joaquim G
Bought by
Federal National Mortgage Association
Purchase Details
Closed on
Aug 25, 1989
Sold by
Raithel John T
Bought by
Oliveira Joaquim G
Create a Home Valuation Report for This Property
The Home Valuation Report is an in-depth analysis detailing your home's value as well as a comparison with similar homes in the area
Purchase History
| Date | Buyer | Sale Price | Title Company |
|---|---|---|---|
| Gelven Suzanne C | $45,000 | -- | |
| Federal National Mortgage Association | $100,000 | -- | |
| Oliveira Joaquim G | $175,000 | -- |
Source: Public Records
Mortgage History
| Date | Status | Borrower | Loan Amount |
|---|---|---|---|
| Open | Oliveira Joaquim G | $304,000 | |
| Closed | Oliveira Joaquim G | $217,500 | |
| Closed | Oliveira Joaquim G | $64,717 | |
| Closed | Oliveira Joaquim G | $40,000 |
Source: Public Records
Tax History
| Year | Tax Paid | Tax Assessment Tax Assessment Total Assessment is a certain percentage of the fair market value that is determined by local assessors to be the total taxable value of land and additions on the property. | Land | Improvement |
|---|---|---|---|---|
| 2025 | $6,941 | $573,200 | $140,700 | $432,500 |
| 2024 | $6,681 | $555,800 | $140,700 | $415,100 |
| 2023 | $6,692 | $515,600 | $107,300 | $408,300 |
| 2022 | $6,285 | $449,900 | $97,600 | $352,300 |
| 2021 | $5,652 | $389,800 | $81,700 | $308,100 |
| 2020 | $4,763 | $314,400 | $75,900 | $238,500 |
| 2019 | $4,957 | $319,000 | $73,800 | $245,200 |
| 2018 | $4,784 | $297,900 | $73,800 | $224,100 |
| 2017 | $4,344 | $269,800 | $73,800 | $196,000 |
| 2016 | $3,993 | $230,000 | $71,800 | $158,200 |
| 2015 | $3,596 | $198,100 | $71,800 | $126,300 |
| 2014 | $3,465 | $191,100 | $71,800 | $119,300 |
Source: Public Records
Map
Nearby Homes
- 14 Emmet St
- 24 E Ashland St
- 30 Elliot St
- 0 Prospect St
- 560 N Montello St
- 35 Huntington St
- 39 Huntington St
- 146 Court St Unit 108
- 69 Beacon Park
- 97 Huntington St
- 271 Ames St
- 29 Saint Casimir Ave
- 90 Cherry St
- 115 Ames St
- 18 Walnut St
- 7 Main St Unit 203
- 7 Main St Unit 102
- 112 Ames St
- 13 Standish St
- 0 Vine St
Your Personal Tour Guide
Ask me questions while you tour the home.