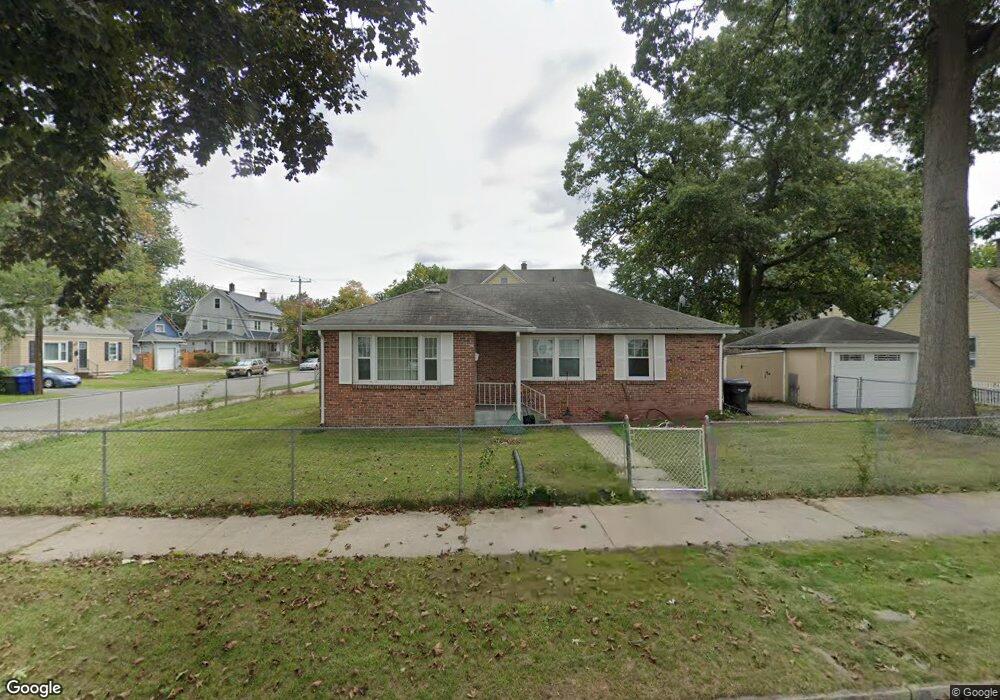
73 Farnsworth St Springfield, MA 01107
Liberty Heights NeighborhoodEstimated Value: $260,000 - $271,078
3
Beds
1
Bath
1,098
Sq Ft
$242/Sq Ft
Est. Value
About This Home
This home is located at 73 Farnsworth St, Springfield, MA 01107 and is currently estimated at $265,270, approximately $241 per square foot. 73 Farnsworth St is a home located in Hampden County with nearby schools including Glenwood School, Van Sickle Academy, and High School Of Commerce.
Ownership History
Date
Name
Owned For
Owner Type
Purchase Details
Closed on
Sep 22, 2004
Sold by
Gmac Mortgage Corp
Bought by
Vazquez Aileen
Current Estimated Value
Home Financials for this Owner
Home Financials are based on the most recent Mortgage that was taken out on this home.
Original Mortgage
$97,268
Outstanding Balance
$48,221
Interest Rate
5.89%
Mortgage Type
Purchase Money Mortgage
Estimated Equity
$217,049
Purchase Details
Closed on
Jun 7, 2002
Sold by
Bonneau Roger E and Bonneau Cecilia M
Bought by
Saporito William J
Home Financials for this Owner
Home Financials are based on the most recent Mortgage that was taken out on this home.
Original Mortgage
$100,769
Interest Rate
6.9%
Mortgage Type
Purchase Money Mortgage
Purchase Details
Closed on
Sep 20, 1996
Sold by
73 Farnsworth St Rt and Anastasia Ruth
Bought by
Bonneau Roger E and Bonneau Cecilia M
Home Financials for this Owner
Home Financials are based on the most recent Mortgage that was taken out on this home.
Original Mortgage
$50,000
Interest Rate
7.89%
Mortgage Type
Purchase Money Mortgage
Create a Home Valuation Report for This Property
The Home Valuation Report is an in-depth analysis detailing your home's value as well as a comparison with similar homes in the area
Home Values in the Area
Average Home Value in this Area
Purchase History
| Date | Buyer | Sale Price | Title Company |
|---|---|---|---|
| Vazquez Aileen | $75,000 | -- | |
| Saporito William J | $102,900 | -- | |
| Bonneau Roger E | $68,000 | -- |
Source: Public Records
Mortgage History
| Date | Status | Borrower | Loan Amount |
|---|---|---|---|
| Open | Vazquez Aileen | $97,268 | |
| Previous Owner | Bonneau Roger E | $100,769 | |
| Previous Owner | Bonneau Roger E | $4,030 | |
| Previous Owner | Bonneau Roger E | $50,000 |
Source: Public Records
Tax History Compared to Growth
Tax History
| Year | Tax Paid | Tax Assessment Tax Assessment Total Assessment is a certain percentage of the fair market value that is determined by local assessors to be the total taxable value of land and additions on the property. | Land | Improvement |
|---|---|---|---|---|
| 2025 | $3,435 | $219,100 | $38,400 | $180,700 |
| 2024 | $2,838 | $176,700 | $38,400 | $138,300 |
| 2023 | $3,042 | $178,400 | $34,000 | $144,400 |
| 2022 | $2,942 | $156,300 | $31,800 | $124,500 |
| 2021 | $2,725 | $144,200 | $28,900 | $115,300 |
| 2020 | $2,726 | $139,600 | $28,900 | $110,700 |
| 2019 | $2,507 | $127,400 | $31,400 | $96,000 |
| 2018 | $2,413 | $122,600 | $31,400 | $91,200 |
| 2017 | $2,298 | $116,900 | $28,400 | $88,500 |
| 2016 | $2,222 | $113,000 | $26,900 | $86,100 |
| 2015 | $2,215 | $112,600 | $26,900 | $85,700 |
Source: Public Records
Map
Nearby Homes
- 0 Milford St (Ws) L:28
- 10 Milford St
- 63 Farnsworth St
- 14 Milford St Unit 16
- 59 Farnsworth St Unit 61
- 85 Farnsworth St
- 70 Farnsworth St
- 74 Farnsworth St
- 9 Milford St
- 66 Farnsworth St
- 80 Farnsworth St
- 62-64 Farnsworth St
- 84 Farnsworth St
- 19 Milford St
- 64 Los Angeles St Unit 66
- 58 Los Angeles St Unit 60
- 58-60 Los Angeles St
- 58-60 Farnsworth St
- 93 Farnsworth St
- 62 Farnsworth St Unit 64