73 Fisher Rd Corinna, ME 04928
Estimated Value: $179,000 - $241,027
1
Bed
1
Bath
1,168
Sq Ft
$186/Sq Ft
Est. Value
About This Home
This home is located at 73 Fisher Rd, Corinna, ME 04928 and is currently estimated at $216,757, approximately $185 per square foot. 73 Fisher Rd is a home located in Penobscot County with nearby schools including Sebasticook Valley Elementary School, Nokomis Regional Middle School/High School, and Dexter Christian Academy.
Ownership History
Date
Name
Owned For
Owner Type
Purchase Details
Closed on
Jun 6, 2007
Sold by
Humphrey Justin O and Humphrey Shizuko M
Bought by
Upperman John C and Upperman Cheryl D
Current Estimated Value
Home Financials for this Owner
Home Financials are based on the most recent Mortgage that was taken out on this home.
Original Mortgage
$98,000
Interest Rate
6.17%
Mortgage Type
Commercial
Create a Home Valuation Report for This Property
The Home Valuation Report is an in-depth analysis detailing your home's value as well as a comparison with similar homes in the area
Home Values in the Area
Average Home Value in this Area
Purchase History
| Date | Buyer | Sale Price | Title Company |
|---|---|---|---|
| Upperman John C | -- | -- |
Source: Public Records
Mortgage History
| Date | Status | Borrower | Loan Amount |
|---|---|---|---|
| Open | Upperman John C | $135,000 | |
| Closed | Upperman John C | $98,000 |
Source: Public Records
Tax History Compared to Growth
Tax History
| Year | Tax Paid | Tax Assessment Tax Assessment Total Assessment is a certain percentage of the fair market value that is determined by local assessors to be the total taxable value of land and additions on the property. | Land | Improvement |
|---|---|---|---|---|
| 2024 | $2,595 | $131,400 | $40,300 | $91,100 |
| 2023 | $2,575 | $131,900 | $40,800 | $91,100 |
| 2022 | $2,657 | $132,200 | $41,100 | $91,100 |
| 2021 | $2,597 | $129,200 | $41,000 | $88,200 |
| 2020 | $2,736 | $129,800 | $41,600 | $88,200 |
| 2019 | $358 | $128,600 | $40,400 | $88,200 |
| 2018 | $2,439 | $128,700 | $40,500 | $88,200 |
| 2017 | $2,370 | $128,800 | $40,600 | $88,200 |
| 2016 | $2,355 | $128,700 | $40,500 | $88,200 |
| 2015 | $2,268 | $127,400 | $39,200 | $88,200 |
| 2014 | $2,179 | $127,400 | $39,200 | $88,200 |
| 2013 | $2,166 | $127,400 | $39,200 | $88,200 |
Source: Public Records
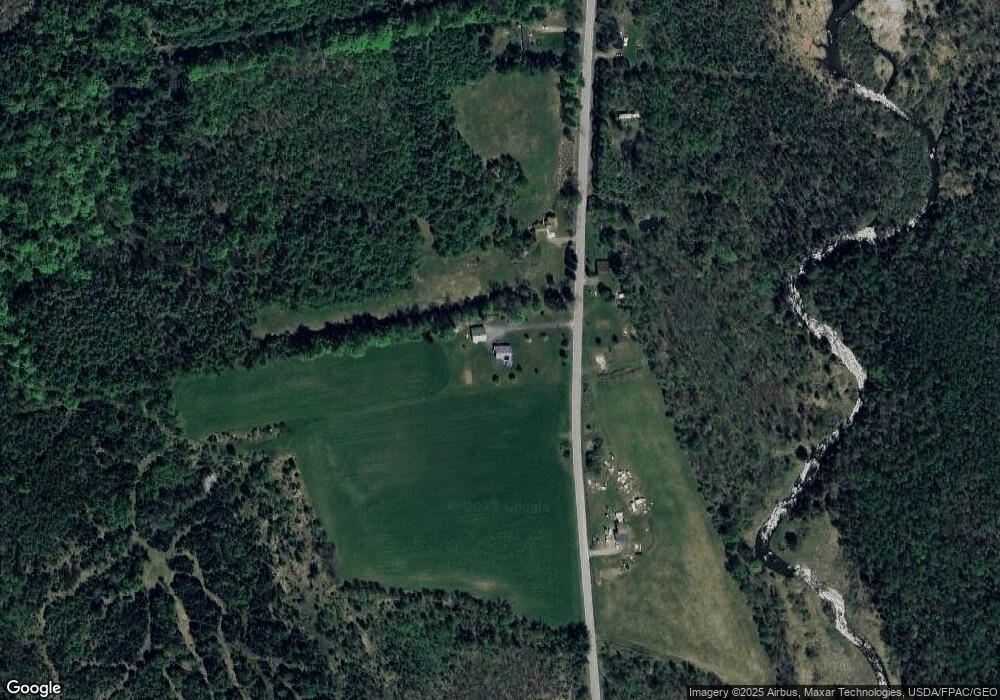
Map
Nearby Homes