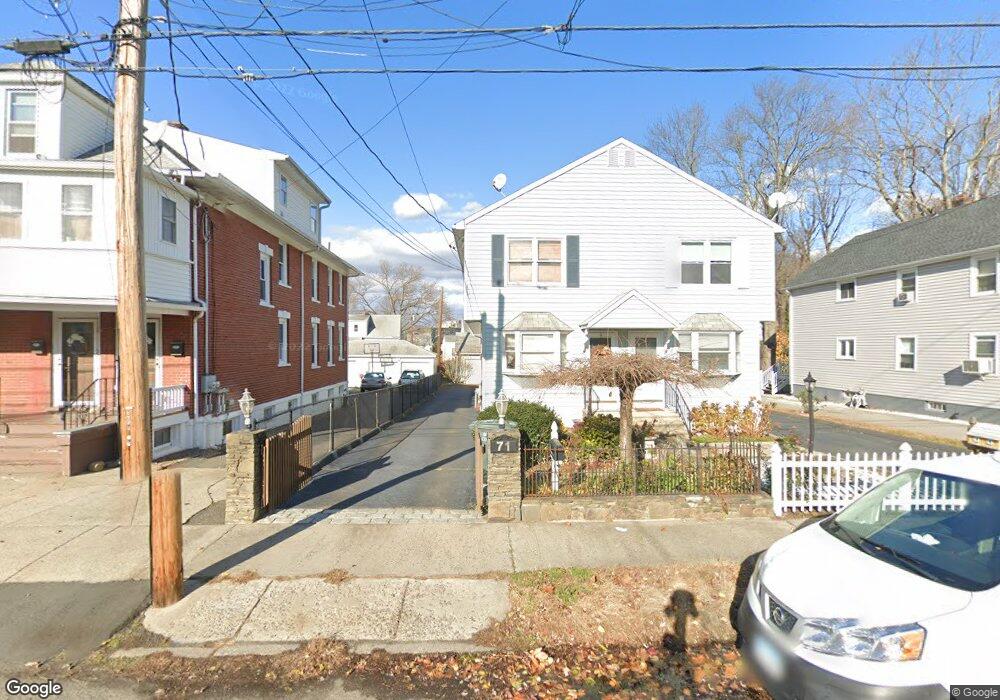
73 Foster Square Bridgeport, CT 06610
North Bridgeport NeighborhoodEstimated Value: $309,000 - $368,000
3
Beds
2
Baths
1,288
Sq Ft
$257/Sq Ft
Est. Value
About This Home
This home is located at 73 Foster Square, Bridgeport, CT 06610 and is currently estimated at $331,384, approximately $257 per square foot. 73 Foster Square is a home located in Fairfield County with nearby schools including Beardsley School, Harding High School, and Achievement First Bridgeport Academy Elementary School.
Ownership History
Date
Name
Owned For
Owner Type
Purchase Details
Closed on
Oct 19, 2006
Sold by
Carrena Jean and Carrena Johanna
Bought by
Pierrottet Estefania and Viera Horacio
Current Estimated Value
Home Financials for this Owner
Home Financials are based on the most recent Mortgage that was taken out on this home.
Original Mortgage
$177,600
Outstanding Balance
$106,153
Interest Rate
6.49%
Estimated Equity
$225,231
Purchase Details
Closed on
Sep 8, 2003
Sold by
Rychlik Sharon M
Bought by
Carrena Jean-Luc E and Carrena Johanna C
Purchase Details
Closed on
Sep 5, 2001
Sold by
Nevarez Miguel A and Nevarez Yvette
Bought by
Ruchlik Sharon M
Purchase Details
Closed on
Dec 16, 1994
Sold by
Memoli Gene A
Bought by
Nevarez Miguel A and Nevarez Yvette
Purchase Details
Closed on
Dec 10, 1987
Sold by
Memoli Angelo
Bought by
-Memoli Michael
Create a Home Valuation Report for This Property
The Home Valuation Report is an in-depth analysis detailing your home's value as well as a comparison with similar homes in the area
Home Values in the Area
Average Home Value in this Area
Purchase History
| Date | Buyer | Sale Price | Title Company |
|---|---|---|---|
| Pierrottet Estefania | $222,000 | -- | |
| Pierrottet Estefania | $222,000 | -- | |
| Carrena Jean-Luc E | $150,000 | -- | |
| Carrena Jean-Luc E | $150,000 | -- | |
| Ruchlik Sharon M | $100,000 | -- | |
| Ruchlik Sharon M | $100,000 | -- | |
| Nevarez Miguel A | $76,000 | -- | |
| Nevarez Miguel A | $76,000 | -- | |
| -Memoli Michael | $97,000 | -- |
Source: Public Records
Mortgage History
| Date | Status | Borrower | Loan Amount |
|---|---|---|---|
| Open | -Memoli Michael | $177,600 | |
| Closed | -Memoli Michael | $177,600 |
Source: Public Records
Tax History Compared to Growth
Tax History
| Year | Tax Paid | Tax Assessment Tax Assessment Total Assessment is a certain percentage of the fair market value that is determined by local assessors to be the total taxable value of land and additions on the property. | Land | Improvement |
|---|---|---|---|---|
| 2025 | $5,531 | $127,295 | $24,425 | $102,870 |
| 2024 | $5,531 | $127,295 | $24,425 | $102,870 |
| 2023 | $5,531 | $127,295 | $24,425 | $102,870 |
| 2022 | $5,531 | $127,295 | $24,425 | $102,870 |
| 2021 | $5,531 | $127,295 | $24,425 | $102,870 |
| 2020 | $4,975 | $92,140 | $23,600 | $68,540 |
| 2019 | $4,975 | $92,140 | $23,600 | $68,540 |
| 2018 | $5,010 | $92,140 | $23,600 | $68,540 |
| 2017 | $5,010 | $92,140 | $23,600 | $68,540 |
| 2016 | $5,010 | $92,140 | $23,600 | $68,540 |
| 2015 | $4,826 | $114,370 | $25,810 | $88,560 |
| 2014 | $4,826 | $114,370 | $25,810 | $88,560 |
Source: Public Records
Map
Nearby Homes
- 170 Livingston Place Unit 172
- 230 Hickory St
- 83 Berkeley Place Unit 85
- 149 Edna Ave Unit 153
- 33 Louisiana Ave Unit 35
- 2080 Noble Ave
- 51 Alpine St
- 11 Nob Hill Cir
- 132 Virginia Ave Unit 132
- 2031 E Main St
- 154 Rose St
- 644 Huntington Rd
- 120 Huntington Turnpike Unit 606
- 647-649 Huntington Rd
- 44 Locust St Unit 46
- 202 Goddard Ave
- 120 Priscilla St
- 112 Glenwood Ave
- 1296 Noble Ave
- 110 Asylum St
- 71 Foster Square
- 79 Foster Square Unit 81
- 89 Foster Square
- 330 Alpine St
- 358 Alpine St
- 103 Foster Square Unit 105
- 61 Foster Square Unit 63
- 360 Alpine St
- 320 Alpine St
- 98 Foster Square
- 80 Foster Square
- 70 Foster Square
- 86 Foster Square
- 378 Alpine St
- 60 Foster Square
- 310 Alpine St
- 55 Foster Square Unit 59
- 300 Alpine St
- 68 Foster Square
- 337 Alpine St