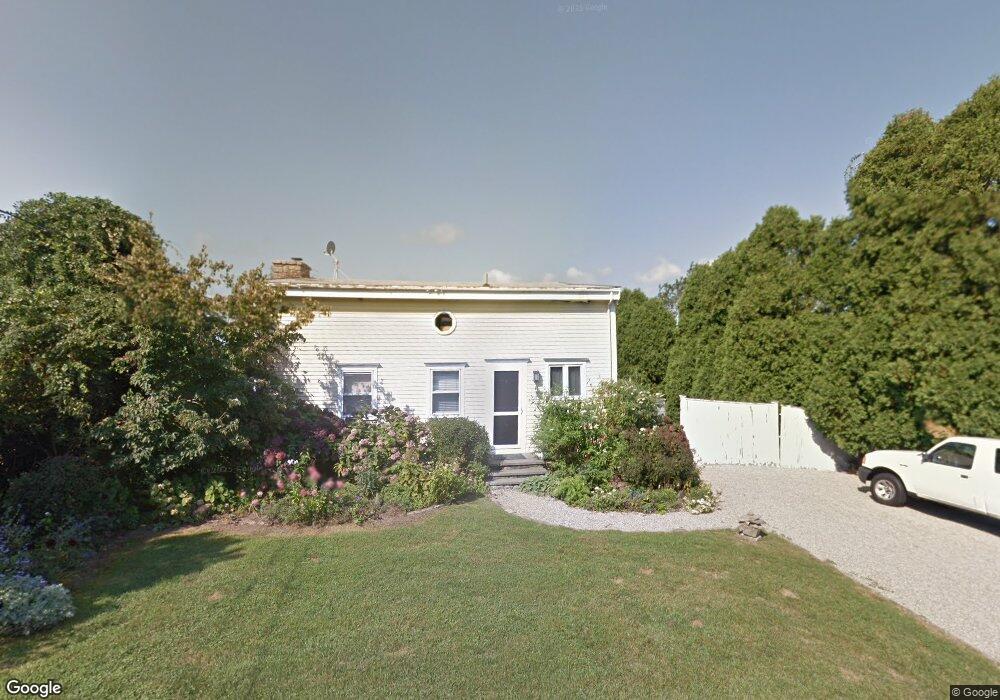
73 Francis Ln Little Compton, RI 02837
Estimated Value: $992,000 - $1,312,000
3
Beds
1
Bath
1,404
Sq Ft
$838/Sq Ft
Est. Value
About This Home
This home is located at 73 Francis Ln, Little Compton, RI 02837 and is currently estimated at $1,176,234, approximately $837 per square foot. 73 Francis Ln is a home located in Newport County with nearby schools including Wilbur & McMahon School.
Ownership History
Date
Name
Owned For
Owner Type
Purchase Details
Closed on
Aug 11, 2015
Sold by
Granbery William P and Granbery Ann H
Bought by
Granbery William P and Granbery Ann H
Current Estimated Value
Purchase Details
Closed on
Apr 29, 2005
Sold by
Coristine Thomas F and Coristine Tracie H
Bought by
Granbery Ann H and Granbery William P
Home Financials for this Owner
Home Financials are based on the most recent Mortgage that was taken out on this home.
Original Mortgage
$250,000
Interest Rate
5.95%
Mortgage Type
Purchase Money Mortgage
Create a Home Valuation Report for This Property
The Home Valuation Report is an in-depth analysis detailing your home's value as well as a comparison with similar homes in the area
Home Values in the Area
Average Home Value in this Area
Purchase History
| Date | Buyer | Sale Price | Title Company |
|---|---|---|---|
| Granbery William P | -- | -- | |
| Granbery Ann H | $570,000 | -- | |
| Granbery William P | -- | -- | |
| Granbery Ann H | $570,000 | -- |
Source: Public Records
Mortgage History
| Date | Status | Borrower | Loan Amount |
|---|---|---|---|
| Previous Owner | Granbery Ann H | $238,000 | |
| Previous Owner | Granbery Ann H | $250,000 | |
| Previous Owner | Granbery Ann H | $91,900 |
Source: Public Records
Tax History
| Year | Tax Paid | Tax Assessment Tax Assessment Total Assessment is a certain percentage of the fair market value that is determined by local assessors to be the total taxable value of land and additions on the property. | Land | Improvement |
|---|---|---|---|---|
| 2025 | $5,102 | $1,065,200 | $416,600 | $648,600 |
| 2024 | $4,257 | $837,900 | $331,800 | $506,100 |
| 2023 | $4,156 | $837,900 | $331,800 | $506,100 |
| 2022 | $4,106 | $837,900 | $331,800 | $506,100 |
| 2021 | $4,683 | $775,400 | $288,500 | $486,900 |
| 2020 | $4,645 | $775,400 | $288,500 | $486,900 |
| 2019 | $4,021 | $678,100 | $288,500 | $389,600 |
| 2018 | $1,983 | $332,800 | $301,600 | $31,200 |
| 2016 | $2,663 | $469,700 | $301,600 | $168,100 |
| 2015 | $2,722 | $473,400 | $298,100 | $175,300 |
| 2014 | $2,670 | $473,400 | $298,100 | $175,300 |
Source: Public Records
Map
Nearby Homes
Your Personal Tour Guide
Ask me questions while you tour the home.