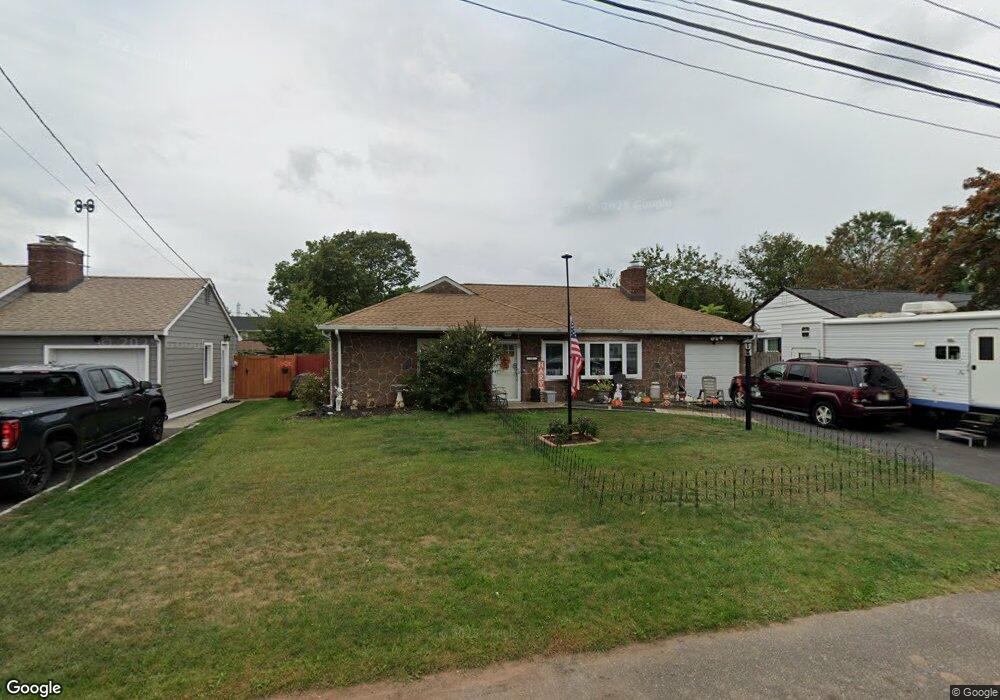
73 George Ave Middlesex, NJ 08846
Estimated Value: $428,715 - $466,000
Studio
--
Bath
--
Sq Ft
6,490
Sq Ft
About This Home
This home is located at 73 George Ave, Middlesex, NJ 08846 and is currently estimated at $449,929. 73 George Ave is a home located in Middlesex County with nearby schools including Middlesex High School and Our Lady of Mount Virgin School.
Ownership History
Date
Name
Owned For
Owner Type
Purchase Details
Closed on
Oct 25, 2000
Sold by
Naumovski Saso
Bought by
Devereaux Donald and Devereaux Darlene
Current Estimated Value
Home Financials for this Owner
Home Financials are based on the most recent Mortgage that was taken out on this home.
Original Mortgage
$117,587
Interest Rate
7.81%
Mortgage Type
FHA
Purchase Details
Closed on
Dec 28, 1995
Sold by
Shipley Cynthia
Bought by
Bunk Sasonaumovski and Bunk Laura
Home Financials for this Owner
Home Financials are based on the most recent Mortgage that was taken out on this home.
Original Mortgage
$107,000
Interest Rate
7.34%
Mortgage Type
FHA
Create a Home Valuation Report for This Property
The Home Valuation Report is an in-depth analysis detailing your home's value as well as a comparison with similar homes in the area
Home Values in the Area
Average Home Value in this Area
Purchase History
| Date | Buyer | Sale Price | Title Company |
|---|---|---|---|
| Devereaux Donald | $134,900 | -- | |
| Bunk Sasonaumovski | $115,000 | -- |
Source: Public Records
Mortgage History
| Date | Status | Borrower | Loan Amount |
|---|---|---|---|
| Previous Owner | Devereaux Donald | $117,587 | |
| Previous Owner | Bunk Sasonaumovski | $107,000 |
Source: Public Records
Tax History
| Year | Tax Paid | Tax Assessment Tax Assessment Total Assessment is a certain percentage of the fair market value that is determined by local assessors to be the total taxable value of land and additions on the property. | Land | Improvement |
|---|---|---|---|---|
| 2025 | $7,726 | $383,900 | $147,500 | $236,400 |
| 2024 | $7,356 | $333,900 | $147,500 | $186,400 |
Source: Public Records
Map
Nearby Homes
- 531 Chestnut St
- 408 Fairview Ave
- 407 Clinton Ave
- 311 Chestnut St
- 116 Greene Ave
- 216 Chestnut St
- 303 Ashland Rd
- 241 Cook Ave
- 310 Howard Ave
- 238 Luca Dr
- 238 Luca Dr Unit 8
- 101 Lorraine Ave
- 531 Harris Ave
- 168 Forest Dr
- 129 Forest Dr
- 212 Vesper Ave
- 107 Forest Dr
- 9 Swing Bridge Ln Unit 118
- 327 Moonlight Dr
- 230 Vasser Dr
Your Personal Tour Guide
Ask me questions while you tour the home.