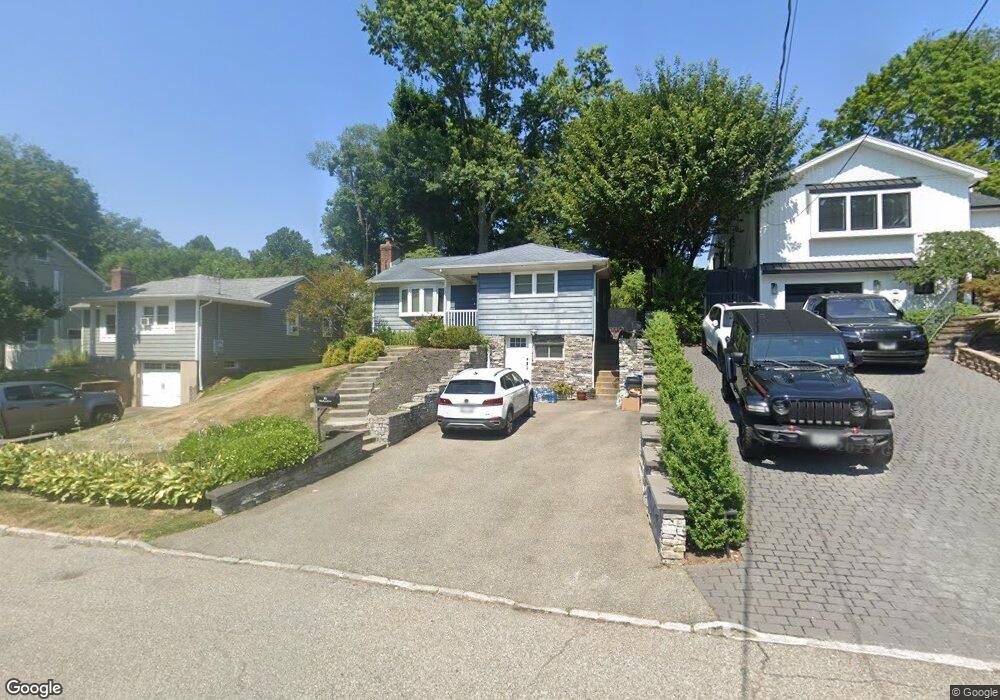
73 Glen Cove Dr Glen Head, NY 11545
Estimated Value: $827,289 - $865,000
3
Beds
1
Bath
1,104
Sq Ft
$766/Sq Ft
Est. Value
About This Home
This home is located at 73 Glen Cove Dr, Glen Head, NY 11545 and is currently estimated at $846,145, approximately $766 per square foot. 73 Glen Cove Dr is a home located in Nassau County with nearby schools including North Shore Middle School and North Shore Senior High School.
Ownership History
Date
Name
Owned For
Owner Type
Purchase Details
Closed on
Sep 18, 2013
Sold by
Blundell Andrew Richard and Blundell Debra
Bought by
Iannelli Christopher and Iannelli Melissa
Current Estimated Value
Home Financials for this Owner
Home Financials are based on the most recent Mortgage that was taken out on this home.
Original Mortgage
$456,577
Outstanding Balance
$342,056
Interest Rate
4.5%
Mortgage Type
FHA
Estimated Equity
$504,089
Purchase Details
Closed on
May 19, 2008
Sold by
Blundell Andrew Richard
Bought by
Blundell Andrew Richard and Blundell Debra
Purchase Details
Closed on
Jan 2, 1998
Sold by
Leslie Ernie
Bought by
Blundell Andrew
Create a Home Valuation Report for This Property
The Home Valuation Report is an in-depth analysis detailing your home's value as well as a comparison with similar homes in the area
Home Values in the Area
Average Home Value in this Area
Purchase History
| Date | Buyer | Sale Price | Title Company |
|---|---|---|---|
| Iannelli Christopher | $465,000 | -- | |
| Blundell Andrew Richard | -- | Attorney | |
| Blundell Andrew | $220,000 | -- |
Source: Public Records
Mortgage History
| Date | Status | Borrower | Loan Amount |
|---|---|---|---|
| Open | Iannelli Christopher | $456,577 |
Source: Public Records
Tax History Compared to Growth
Tax History
| Year | Tax Paid | Tax Assessment Tax Assessment Total Assessment is a certain percentage of the fair market value that is determined by local assessors to be the total taxable value of land and additions on the property. | Land | Improvement |
|---|---|---|---|---|
| 2025 | $14,065 | $594 | $256 | $338 |
| 2024 | $4,194 | $594 | $256 | $338 |
| 2023 | $12,230 | $565 | $244 | $321 |
| 2022 | $12,230 | $594 | $256 | $338 |
| 2021 | $12,345 | $589 | $254 | $335 |
| 2020 | $11,779 | $826 | $575 | $251 |
| 2019 | $10,787 | $1,051 | $732 | $319 |
| 2018 | $12,984 | $1,051 | $0 | $0 |
| 2017 | $7,664 | $1,030 | $732 | $298 |
| 2016 | $11,740 | $1,030 | $732 | $298 |
| 2015 | $3,608 | $1,030 | $732 | $298 |
| 2014 | $3,608 | $1,030 | $732 | $298 |
| 2013 | $3,240 | $1,030 | $732 | $298 |
Source: Public Records
Map
Nearby Homes