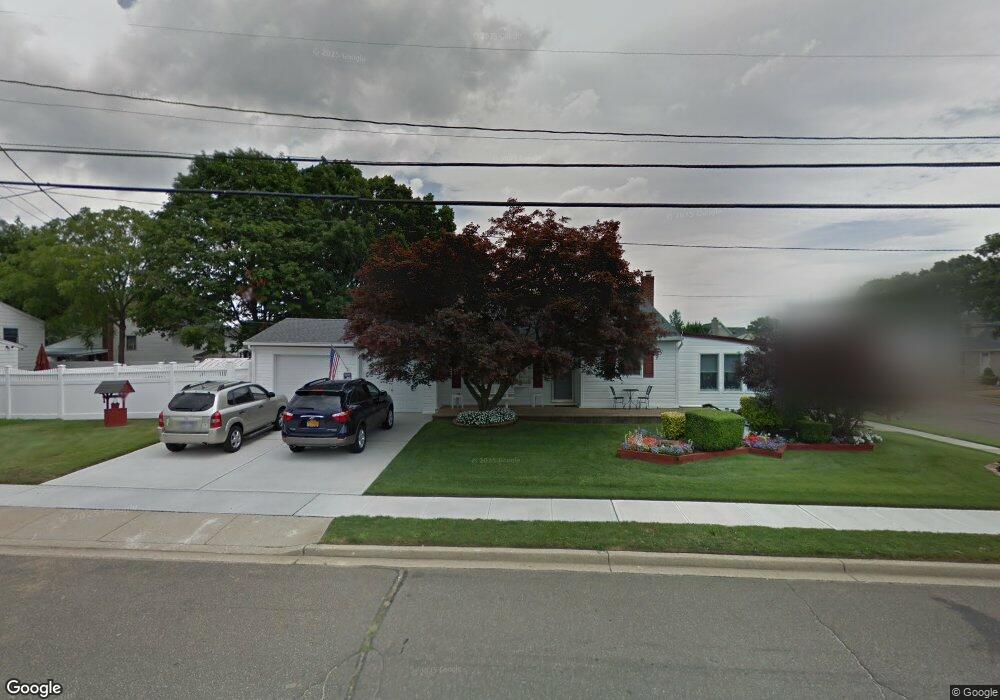
73 Graham St Farmingdale, NY 11735
Estimated Value: $650,000 - $661,380
--
Bed
2
Baths
1,534
Sq Ft
$427/Sq Ft
Est. Value
About This Home
This home is located at 73 Graham St, Farmingdale, NY 11735 and is currently estimated at $655,690, approximately $427 per square foot. 73 Graham St is a home located in Nassau County with nearby schools including Woodward Parkway Elementary School, Weldon E. Howitt Middle School, and Farmingdale Senior High School.
Ownership History
Date
Name
Owned For
Owner Type
Purchase Details
Closed on
Aug 31, 2020
Sold by
Ostrowski Kenneth R and Ostrowski Arlene
Bought by
Leger Brian J and Fier Risa L
Current Estimated Value
Home Financials for this Owner
Home Financials are based on the most recent Mortgage that was taken out on this home.
Original Mortgage
$412,087
Outstanding Balance
$365,700
Interest Rate
2.9%
Mortgage Type
FHA
Estimated Equity
$289,990
Purchase Details
Closed on
Mar 8, 2011
Sold by
Butler Michael R
Bought by
Butler Michael R
Purchase Details
Closed on
Feb 17, 2010
Sold by
Hanna Kaleel and Hanna Leila
Bought by
73 Graham Ave Llc
Create a Home Valuation Report for This Property
The Home Valuation Report is an in-depth analysis detailing your home's value as well as a comparison with similar homes in the area
Home Values in the Area
Average Home Value in this Area
Purchase History
| Date | Buyer | Sale Price | Title Company |
|---|---|---|---|
| Leger Brian J | $450,000 | Commonwealth Land Title | |
| Butler Michael R | -- | -- | |
| 73 Graham Ave Llc | -- | -- |
Source: Public Records
Mortgage History
| Date | Status | Borrower | Loan Amount |
|---|---|---|---|
| Open | Leger Brian J | $412,087 |
Source: Public Records
Tax History Compared to Growth
Tax History
| Year | Tax Paid | Tax Assessment Tax Assessment Total Assessment is a certain percentage of the fair market value that is determined by local assessors to be the total taxable value of land and additions on the property. | Land | Improvement |
|---|---|---|---|---|
| 2025 | $12,372 | $430 | $191 | $239 |
| 2024 | $3,872 | $434 | $198 | $236 |
| 2023 | $15,156 | $515 | $231 | $284 |
| 2022 | $15,156 | $515 | $231 | $284 |
| 2021 | $15,690 | $497 | $223 | $274 |
| 2020 | $12,871 | $860 | $539 | $321 |
| 2019 | $4,535 | $860 | $539 | $321 |
| 2018 | $6,479 | $860 | $0 | $0 |
| 2017 | $6,479 | $860 | $539 | $321 |
| 2016 | $10,785 | $860 | $539 | $321 |
| 2015 | $3,663 | $860 | $539 | $321 |
| 2014 | $3,663 | $860 | $539 | $321 |
| 2013 | $3,338 | $860 | $539 | $321 |
Source: Public Records
Map
Nearby Homes