Estimated Value: $429,000 - $572,135
3
Beds
1
Bath
1,012
Sq Ft
$520/Sq Ft
Est. Value
About This Home
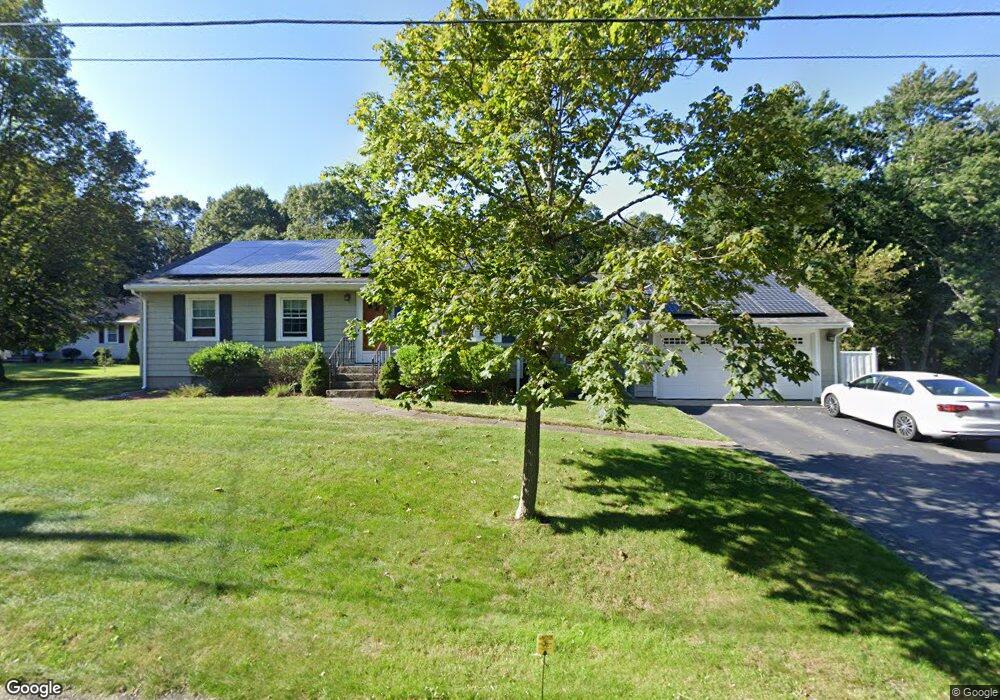
This home is located at 73 Granite St, Avon, MA 02322 and is currently estimated at $526,034, approximately $519 per square foot. 73 Granite St is a home located in Norfolk County with nearby schools including Ralph D. Butler Elementary School, Avon Middle/High School, and Lighthouse Baptist Christian Academy.
Ownership History
Date
Name
Owned For
Owner Type
Purchase Details
Closed on
Feb 15, 2023
Sold by
Goldsmith Adam B and Graham Stephanie L
Bought by
Goldsmith Ft
Current Estimated Value
Purchase Details
Closed on
Mar 27, 2000
Sold by
Bostrom Judith M and Bostrom Don W
Bought by
Goldsmith Adam B
Home Financials for this Owner
Home Financials are based on the most recent Mortgage that was taken out on this home.
Original Mortgage
$154,000
Interest Rate
8.31%
Mortgage Type
Purchase Money Mortgage
Create a Home Valuation Report for This Property
The Home Valuation Report is an in-depth analysis detailing your home's value as well as a comparison with similar homes in the area
Home Values in the Area
Average Home Value in this Area
Purchase History
| Date | Buyer | Sale Price | Title Company |
|---|---|---|---|
| Goldsmith Ft | -- | None Available | |
| Goldsmith Adam B | $169,000 | -- |
Source: Public Records
Mortgage History
| Date | Status | Borrower | Loan Amount |
|---|---|---|---|
| Previous Owner | Goldsmith Adam B | $252,000 | |
| Previous Owner | Goldsmith Adam B | $25,500 | |
| Previous Owner | Goldsmith Adam B | $154,000 | |
| Previous Owner | Goldsmith Adam B | $154,000 |
Source: Public Records
Tax History Compared to Growth
Tax History
| Year | Tax Paid | Tax Assessment Tax Assessment Total Assessment is a certain percentage of the fair market value that is determined by local assessors to be the total taxable value of land and additions on the property. | Land | Improvement |
|---|---|---|---|---|
| 2025 | $67 | $503,800 | $231,000 | $272,800 |
| 2024 | $6,090 | $434,100 | $209,300 | $224,800 |
| 2023 | $5,912 | $434,100 | $209,300 | $224,800 |
| 2022 | $6,005 | $379,800 | $174,500 | $205,300 |
| 2021 | $5,490 | $327,200 | $158,500 | $168,700 |
| 2020 | $5,898 | $333,200 | $155,300 | $177,900 |
| 2019 | $5,249 | $291,800 | $148,400 | $143,400 |
| 2018 | $5,337 | $287,700 | $148,400 | $139,300 |
| 2017 | $4,695 | $271,700 | $148,400 | $123,300 |
| 2016 | $4,611 | $269,500 | $141,300 | $128,200 |
| 2015 | $4,214 | $257,400 | $134,800 | $122,600 |
Source: Public Records
Map
Nearby Homes