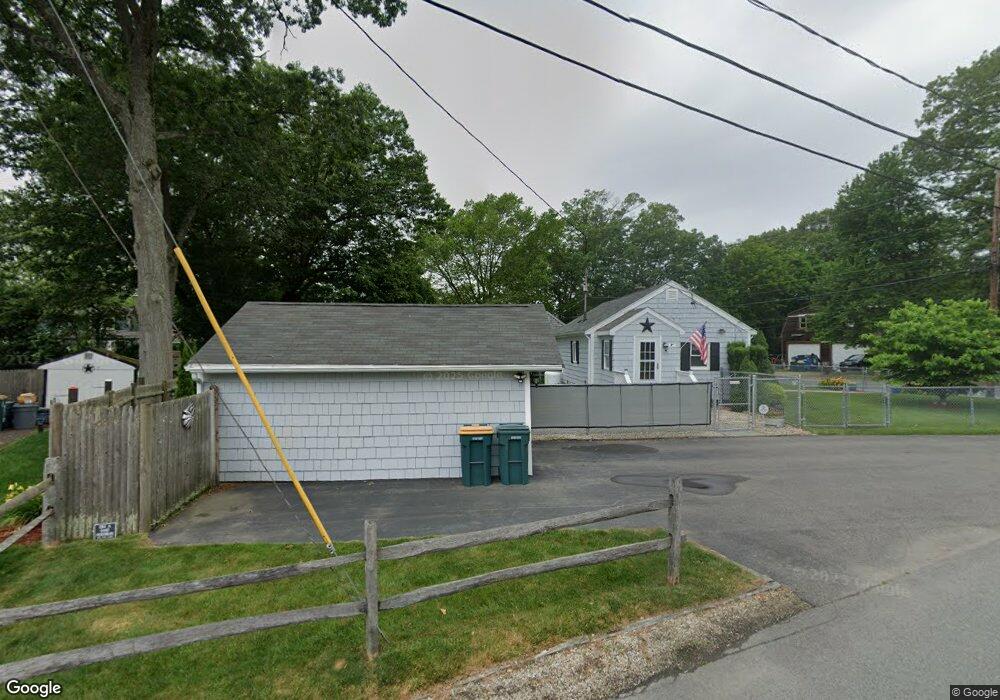
73 Green St Abington, MA 02351
Estimated Value: $405,000 - $431,120
2
Beds
1
Bath
660
Sq Ft
$633/Sq Ft
Est. Value
About This Home
This home is located at 73 Green St, Abington, MA 02351 and is currently estimated at $418,030, approximately $633 per square foot. 73 Green St is a home located in Plymouth County with nearby schools including Beaver Brook Elementary School, Abington Middle School, and Woodsdale School.
Ownership History
Date
Name
Owned For
Owner Type
Purchase Details
Closed on
Sep 12, 2024
Sold by
Pratti Debora J
Bought by
Pratti Irt and Pratti
Current Estimated Value
Purchase Details
Closed on
Mar 30, 2001
Sold by
Cheverie Paul L and Cheverie Linda L
Bought by
Pratti Debora J
Home Financials for this Owner
Home Financials are based on the most recent Mortgage that was taken out on this home.
Original Mortgage
$149,077
Interest Rate
6.96%
Mortgage Type
Purchase Money Mortgage
Purchase Details
Closed on
May 28, 1996
Sold by
Ge Capital Asset Mgmt
Bought by
Cheverie Paul L
Purchase Details
Closed on
Feb 17, 1995
Sold by
Desmond Dennis J and Desmond Debra
Bought by
Ge Capital Asset Mgmt
Create a Home Valuation Report for This Property
The Home Valuation Report is an in-depth analysis detailing your home's value as well as a comparison with similar homes in the area
Home Values in the Area
Average Home Value in this Area
Purchase History
| Date | Buyer | Sale Price | Title Company |
|---|---|---|---|
| Pratti Irt | -- | None Available | |
| Pratti Irt | -- | None Available | |
| Pratti Debora J | $151,000 | -- | |
| Cheverie Paul L | $96,300 | -- | |
| Ge Capital Asset Mgmt | $94,000 | -- |
Source: Public Records
Mortgage History
| Date | Status | Borrower | Loan Amount |
|---|---|---|---|
| Previous Owner | Ge Capital Asset Mgmt | $140,000 | |
| Previous Owner | Ge Capital Asset Mgmt | $149,077 | |
| Previous Owner | Ge Capital Asset Mgmt | $107,100 |
Source: Public Records
Tax History Compared to Growth
Tax History
| Year | Tax Paid | Tax Assessment Tax Assessment Total Assessment is a certain percentage of the fair market value that is determined by local assessors to be the total taxable value of land and additions on the property. | Land | Improvement |
|---|---|---|---|---|
| 2025 | $4,643 | $355,500 | $209,300 | $146,200 |
| 2024 | $4,371 | $326,700 | $190,300 | $136,400 |
| 2023 | $4,384 | $308,500 | $165,500 | $143,000 |
| 2022 | $4,256 | $279,600 | $144,800 | $134,800 |
| 2021 | $4,133 | $250,800 | $131,300 | $119,500 |
| 2020 | $4,315 | $253,800 | $137,900 | $115,900 |
| 2019 | $3,854 | $221,600 | $131,300 | $90,300 |
| 2018 | $3,906 | $219,200 | $131,300 | $87,900 |
| 2017 | $3,644 | $198,600 | $131,300 | $67,300 |
| 2016 | $3,364 | $187,600 | $125,100 | $62,500 |
| 2015 | $3,108 | $182,800 | $125,100 | $57,700 |
Source: Public Records
Map
Nearby Homes