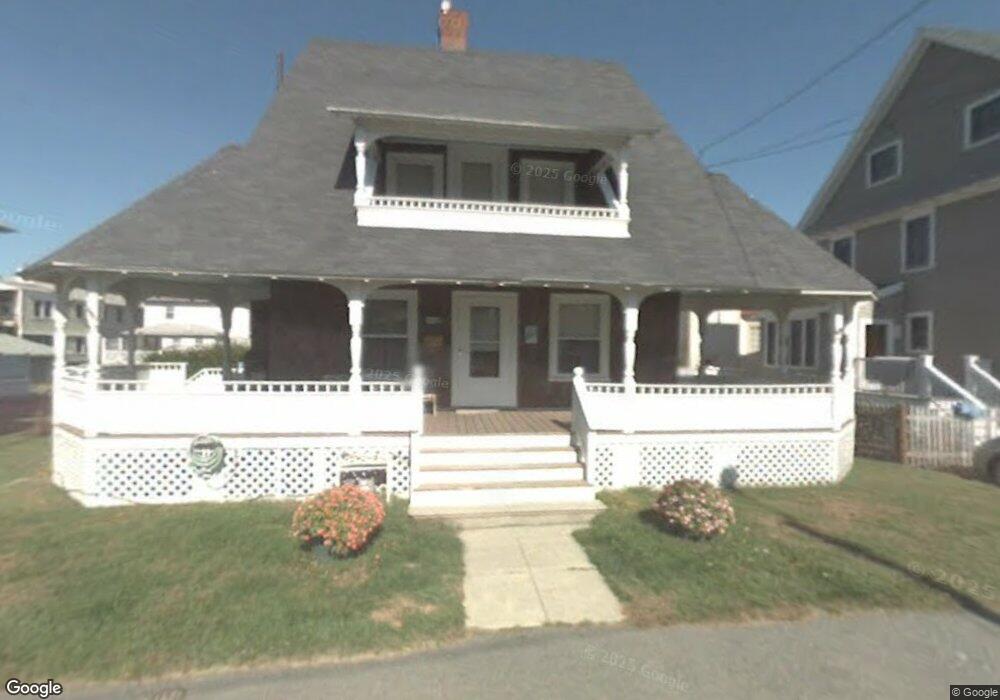
73 H St Hull, MA 02045
The Alphabets NeighborhoodEstimated Value: $662,948 - $746,000
4
Beds
2
Baths
1,527
Sq Ft
$458/Sq Ft
Est. Value
About This Home
This home is located at 73 H St, Hull, MA 02045 and is currently estimated at $699,737, approximately $458 per square foot. 73 H St is a home located in Plymouth County with nearby schools including Lillian M. Jacobs Elementary School, Memorial Middle School, and Hull High School.
Ownership History
Date
Name
Owned For
Owner Type
Purchase Details
Closed on
Nov 25, 2025
Sold by
Rubenstein Lisa M and Rubenstein Mark R
Bought by
Rubenstein Ft and Rubenstein
Current Estimated Value
Purchase Details
Closed on
Jul 11, 2022
Sold by
Buono-Lajoie Donna
Bought by
White John P
Purchase Details
Closed on
Jun 3, 2022
Sold by
Sullivan Nina L and Sullivan Paul
Bought by
White John P
Purchase Details
Closed on
May 31, 2022
Sold by
Leone Robert F and Leone Carol J
Bought by
White John P
Purchase Details
Closed on
May 12, 2022
Sold by
Butler-Larrea Dianne
Bought by
White John P
Purchase Details
Closed on
May 10, 2022
Sold by
Hodgerney Mary
Bought by
White John P
Purchase Details
Closed on
Apr 12, 2022
Sold by
Morland Beth
Bought by
White John P
Purchase Details
Closed on
Apr 11, 2022
Sold by
Butler Daniel N
Bought by
White John P
Purchase Details
Closed on
Mar 18, 2022
Sold by
Butler Michael D
Bought by
White John P
Purchase Details
Closed on
Jun 1, 1969
Bought by
White John P and White Grace L
Create a Home Valuation Report for This Property
The Home Valuation Report is an in-depth analysis detailing your home's value as well as a comparison with similar homes in the area
Home Values in the Area
Average Home Value in this Area
Purchase History
| Date | Buyer | Sale Price | Title Company |
|---|---|---|---|
| Rubenstein Ft | -- | -- | |
| White John P | -- | None Available | |
| White John P | -- | None Available | |
| White John P | -- | None Available | |
| White John P | -- | None Available | |
| White John P | -- | None Available | |
| White John P | -- | None Available | |
| White John P | -- | None Available | |
| White John P | -- | None Available | |
| White John P | -- | None Available | |
| White John P | -- | -- |
Source: Public Records
Tax History Compared to Growth
Tax History
| Year | Tax Paid | Tax Assessment Tax Assessment Total Assessment is a certain percentage of the fair market value that is determined by local assessors to be the total taxable value of land and additions on the property. | Land | Improvement |
|---|---|---|---|---|
| 2025 | $5,976 | $533,600 | $306,800 | $226,800 |
| 2024 | $5,696 | $488,900 | $283,200 | $205,700 |
| 2023 | $5,249 | $431,300 | $236,000 | $195,300 |
| 2022 | $5,218 | $416,100 | $224,200 | $191,900 |
| 2021 | $7,952 | $415,400 | $224,200 | $191,200 |
| 2020 | $5,038 | $393,000 | $224,200 | $168,800 |
| 2019 | $4,754 | $364,300 | $200,600 | $163,700 |
| 2018 | $4,611 | $343,600 | $200,600 | $143,000 |
| 2017 | $6,299 | $338,400 | $200,600 | $137,800 |
| 2016 | $4,562 | $338,400 | $200,600 | $137,800 |
| 2015 | $4,388 | $314,800 | $177,000 | $137,800 |
| 2014 | $4,223 | $304,500 | $177,000 | $127,500 |
Source: Public Records
Map
Nearby Homes