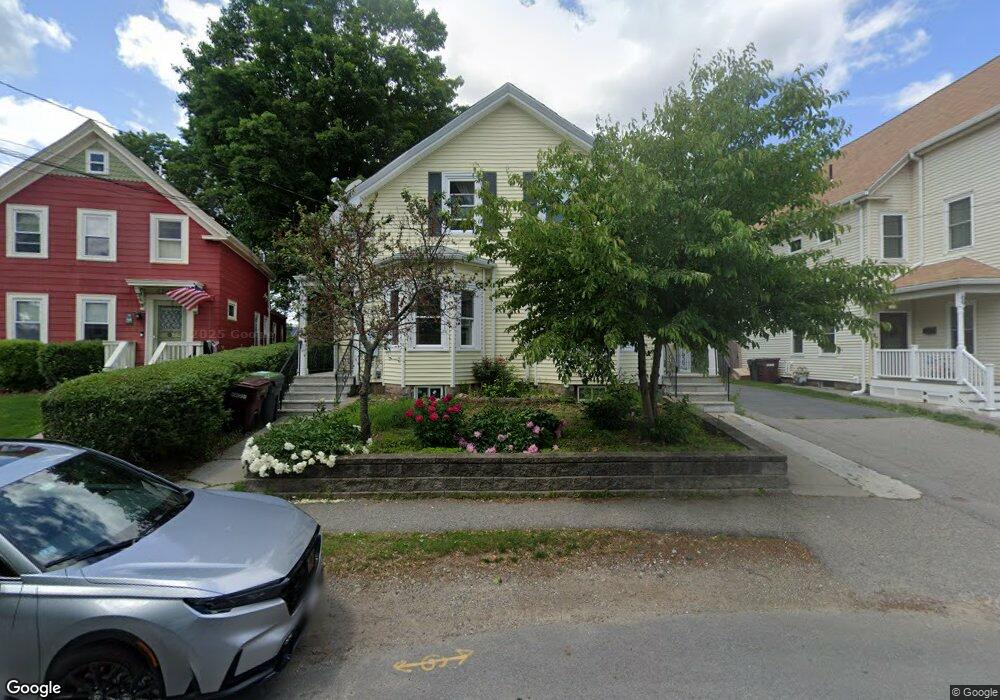
73 Harvard St Dedham, MA 02026
East Dedham NeighborhoodEstimated Value: $794,000 - $948,000
6
Beds
2
Baths
2,224
Sq Ft
$387/Sq Ft
Est. Value
About This Home
This home is located at 73 Harvard St, Dedham, MA 02026 and is currently estimated at $861,518, approximately $387 per square foot. 73 Harvard St is a home located in Norfolk County with nearby schools including Avery, Dedham Middle School, and Dedham High School.
Ownership History
Date
Name
Owned For
Owner Type
Purchase Details
Closed on
Sep 21, 2015
Sold by
Karam Heins N
Bought by
Kairouz Mansour and Alkhouri Rasha
Current Estimated Value
Home Financials for this Owner
Home Financials are based on the most recent Mortgage that was taken out on this home.
Original Mortgage
$278,000
Interest Rate
3.94%
Mortgage Type
New Conventional
Purchase Details
Closed on
Nov 16, 2004
Sold by
Ceglarski James K and Ceglarski John W
Bought by
Karam Heins N
Home Financials for this Owner
Home Financials are based on the most recent Mortgage that was taken out on this home.
Original Mortgage
$312,000
Interest Rate
5.75%
Mortgage Type
Purchase Money Mortgage
Create a Home Valuation Report for This Property
The Home Valuation Report is an in-depth analysis detailing your home's value as well as a comparison with similar homes in the area
Home Values in the Area
Average Home Value in this Area
Purchase History
| Date | Buyer | Sale Price | Title Company |
|---|---|---|---|
| Kairouz Mansour | $350,000 | -- | |
| Karam Heins N | $390,000 | -- |
Source: Public Records
Mortgage History
| Date | Status | Borrower | Loan Amount |
|---|---|---|---|
| Closed | Kairouz Mansour | $278,000 | |
| Previous Owner | Karam Heins N | $312,000 | |
| Previous Owner | Karam Heins N | $38,960 |
Source: Public Records
Tax History
| Year | Tax Paid | Tax Assessment Tax Assessment Total Assessment is a certain percentage of the fair market value that is determined by local assessors to be the total taxable value of land and additions on the property. | Land | Improvement |
|---|---|---|---|---|
| 2025 | $9,134 | $723,800 | $320,500 | $403,300 |
| 2024 | $8,493 | $679,400 | $290,800 | $388,600 |
| 2023 | $8,017 | $624,400 | $263,300 | $361,100 |
| 2022 | $7,782 | $582,900 | $247,300 | $335,600 |
| 2021 | $7,503 | $548,900 | $229,000 | $319,900 |
| 2020 | $7,152 | $521,300 | $229,000 | $292,300 |
| 2019 | $6,677 | $471,900 | $199,100 | $272,800 |
| 2018 | $6,531 | $448,900 | $176,100 | $272,800 |
| 2017 | $6,161 | $417,400 | $165,100 | $252,300 |
| 2016 | $6,277 | $405,200 | $152,900 | $252,300 |
| 2015 | $5,989 | $377,400 | $146,500 | $230,900 |
| 2014 | $6,086 | $378,500 | $143,700 | $234,800 |
Source: Public Records
Map
Nearby Homes
- 42 Churchill Place
- 442 High St
- 28 Linden Place
- 92 Old River Place
- 56 Mount Vernon St
- 46 Church St
- 441 Washington St Unit 301
- 441 Washington St Unit 302
- 55 Church St Unit 1
- 44 Court St
- 8 Sumner St
- 147 Mount Vernon St
- 47 Village Ave Unit 203
- 108 High St
- 75 Bingham Ave
- 90 High St Unit 309
- 46 Park St
- 109 Rockland St
- 25 Rockland St Unit 5
- 570 Bridge St
Your Personal Tour Guide
Ask me questions while you tour the home.