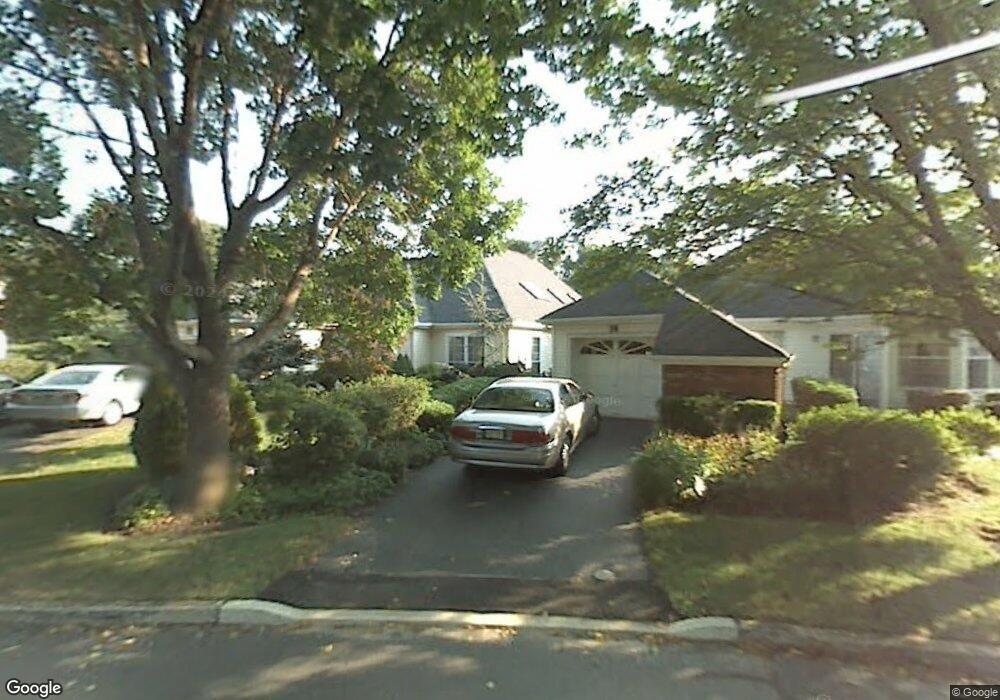
73 Hazel Dr Freehold, NJ 07728
Estimated Value: $519,000 - $611,000
2
Beds
3
Baths
1,606
Sq Ft
$345/Sq Ft
Est. Value
About This Home
This home is located at 73 Hazel Dr, Freehold, NJ 07728 and is currently estimated at $554,543, approximately $345 per square foot. 73 Hazel Dr is a home located in Monmouth County with nearby schools including West Freehold Elementary School, Clifton T. Barkalow Middle School, and Freehold Township High School.
Ownership History
Date
Name
Owned For
Owner Type
Purchase Details
Closed on
Jun 16, 1998
Sold by
Dorman Arnold
Bought by
Ettel Walter and Wolosky Wendy
Current Estimated Value
Home Financials for this Owner
Home Financials are based on the most recent Mortgage that was taken out on this home.
Original Mortgage
$145,000
Outstanding Balance
$28,857
Interest Rate
6.99%
Estimated Equity
$525,686
Create a Home Valuation Report for This Property
The Home Valuation Report is an in-depth analysis detailing your home's value as well as a comparison with similar homes in the area
Home Values in the Area
Average Home Value in this Area
Purchase History
| Date | Buyer | Sale Price | Title Company |
|---|---|---|---|
| Ettel Walter | $162,000 | -- |
Source: Public Records
Mortgage History
| Date | Status | Borrower | Loan Amount |
|---|---|---|---|
| Open | Ettel Walter | $145,000 |
Source: Public Records
Tax History Compared to Growth
Tax History
| Year | Tax Paid | Tax Assessment Tax Assessment Total Assessment is a certain percentage of the fair market value that is determined by local assessors to be the total taxable value of land and additions on the property. | Land | Improvement |
|---|---|---|---|---|
| 2025 | $8,594 | $504,000 | $210,000 | $294,000 |
| 2024 | $8,710 | $474,800 | $210,000 | $264,800 |
| 2023 | $8,710 | $467,300 | $225,000 | $242,300 |
| 2022 | $7,466 | $395,900 | $145,000 | $250,900 |
| 2021 | $7,838 | $346,300 | $115,000 | $231,300 |
| 2020 | $7,157 | $329,800 | $105,000 | $224,800 |
| 2019 | $7,838 | $358,700 | $100,000 | $258,700 |
| 2018 | $7,710 | $345,100 | $100,000 | $245,100 |
| 2017 | $6,869 | $302,600 | $65,000 | $237,600 |
| 2016 | $6,681 | $288,100 | $55,000 | $233,100 |
| 2015 | $6,401 | $279,400 | $55,000 | $224,400 |
| 2014 | $6,426 | $269,000 | $55,000 | $214,000 |
Source: Public Records
Map
Nearby Homes