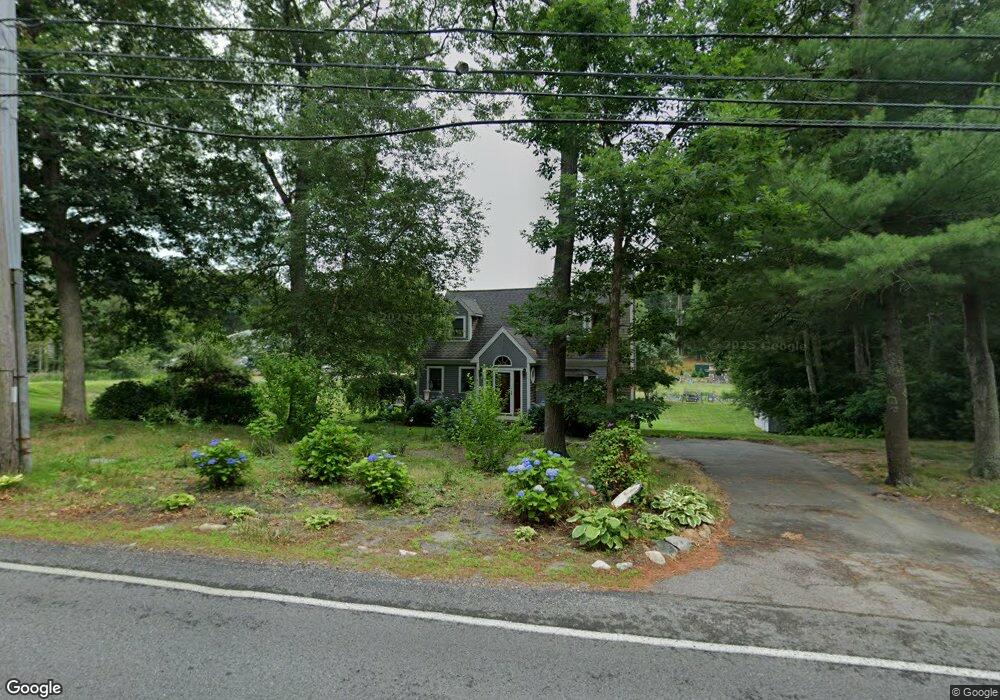
73 High St Carver, MA 02330
Estimated Value: $562,000 - $607,000
3
Beds
2
Baths
1,376
Sq Ft
$421/Sq Ft
Est. Value
About This Home
This home is located at 73 High St, Carver, MA 02330 and is currently estimated at $579,426, approximately $421 per square foot. 73 High St is a home located in Plymouth County with nearby schools including Carver Elementary School and Carver Middle/High School.
Ownership History
Date
Name
Owned For
Owner Type
Purchase Details
Closed on
Mar 16, 2007
Sold by
Wall Donna M
Bought by
Wall Robert R
Current Estimated Value
Home Financials for this Owner
Home Financials are based on the most recent Mortgage that was taken out on this home.
Original Mortgage
$265,000
Outstanding Balance
$161,626
Interest Rate
6.4%
Mortgage Type
Purchase Money Mortgage
Estimated Equity
$417,800
Purchase Details
Closed on
Apr 30, 1996
Sold by
Bilodeau Marc J and Bilodeau Carol A
Bought by
Wall Robert R and Wall Donna M
Home Financials for this Owner
Home Financials are based on the most recent Mortgage that was taken out on this home.
Original Mortgage
$123,000
Interest Rate
7.81%
Mortgage Type
Purchase Money Mortgage
Purchase Details
Closed on
Jan 22, 1992
Sold by
Regional East Dev Corp
Bought by
Bilodeau Mark J and Bilodeau Carol A
Create a Home Valuation Report for This Property
The Home Valuation Report is an in-depth analysis detailing your home's value as well as a comparison with similar homes in the area
Home Values in the Area
Average Home Value in this Area
Purchase History
| Date | Buyer | Sale Price | Title Company |
|---|---|---|---|
| Wall Robert R | $60,000 | -- | |
| Wall Robert R | $123,000 | -- | |
| Bilodeau Mark J | $120,500 | -- |
Source: Public Records
Mortgage History
| Date | Status | Borrower | Loan Amount |
|---|---|---|---|
| Open | Bilodeau Mark J | $265,000 | |
| Previous Owner | Bilodeau Mark J | $60,000 | |
| Previous Owner | Bilodeau Mark J | $139,500 | |
| Previous Owner | Bilodeau Mark J | $123,000 |
Source: Public Records
Tax History
| Year | Tax Paid | Tax Assessment Tax Assessment Total Assessment is a certain percentage of the fair market value that is determined by local assessors to be the total taxable value of land and additions on the property. | Land | Improvement |
|---|---|---|---|---|
| 2025 | $6,588 | $475,000 | $154,900 | $320,100 |
| 2024 | $6,201 | $437,600 | $151,900 | $285,700 |
| 2023 | $6,050 | $414,700 | $151,900 | $262,800 |
| 2022 | $5,716 | $357,700 | $129,900 | $227,800 |
| 2021 | $5,497 | $324,500 | $116,000 | $208,500 |
| 2020 | $5,240 | $304,800 | $108,400 | $196,400 |
| 2019 | $5,096 | $298,900 | $105,200 | $193,700 |
| 2018 | $4,799 | $272,200 | $105,200 | $167,000 |
| 2017 | $4,635 | $262,000 | $101,200 | $160,800 |
| 2016 | $4,268 | $250,600 | $96,400 | $154,200 |
| 2015 | $4,188 | $246,200 | $96,400 | $149,800 |
| 2014 | $4,203 | $247,100 | $121,900 | $125,200 |
Source: Public Records
Map
Nearby Homes
Your Personal Tour Guide
Ask me questions while you tour the home.