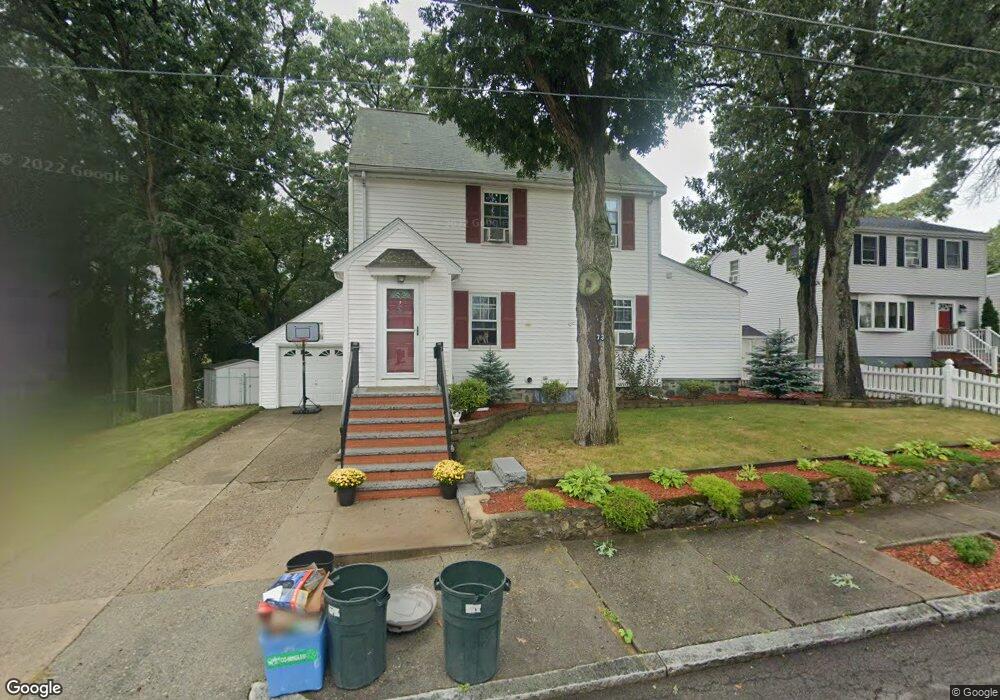
73 Hill St Malden, MA 02148
Forestdale NeighborhoodEstimated Value: $738,000 - $841,000
3
Beds
3
Baths
1,721
Sq Ft
$456/Sq Ft
Est. Value
About This Home
This home is located at 73 Hill St, Malden, MA 02148 and is currently estimated at $784,468, approximately $455 per square foot. 73 Hill St is a home located in Middlesex County with nearby schools including Malden High School, Cheverus Catholic School, and Malden Catholic.
Ownership History
Date
Name
Owned For
Owner Type
Purchase Details
Closed on
Feb 26, 1992
Sold by
Rivers Constr Inc
Bought by
Brown Ii Francis K and Brown Theresa E
Current Estimated Value
Purchase Details
Closed on
Jun 28, 1991
Sold by
Gibson Charles A and Gibson Julie M
Bought by
Rivers Contr Inc
Create a Home Valuation Report for This Property
The Home Valuation Report is an in-depth analysis detailing your home's value as well as a comparison with similar homes in the area
Home Values in the Area
Average Home Value in this Area
Purchase History
| Date | Buyer | Sale Price | Title Company |
|---|---|---|---|
| Brown Ii Francis K | $162,000 | -- | |
| Brown Ii Francis K | $162,000 | -- | |
| Rivers Contr Inc | $34,000 | -- | |
| Gibson Charles A | $174,000 | -- |
Source: Public Records
Mortgage History
| Date | Status | Borrower | Loan Amount |
|---|---|---|---|
| Open | Gibson Charles A | $200,000 | |
| Closed | Gibson Charles A | $160,000 | |
| Closed | Gibson Charles A | $136,000 |
Source: Public Records
Tax History Compared to Growth
Tax History
| Year | Tax Paid | Tax Assessment Tax Assessment Total Assessment is a certain percentage of the fair market value that is determined by local assessors to be the total taxable value of land and additions on the property. | Land | Improvement |
|---|---|---|---|---|
| 2025 | $78 | $687,800 | $332,800 | $355,000 |
| 2024 | $7,443 | $636,700 | $309,400 | $327,300 |
| 2023 | $7,181 | $589,100 | $281,600 | $307,500 |
| 2022 | $6,916 | $560,000 | $260,300 | $299,700 |
| 2021 | $6,571 | $534,700 | $244,500 | $290,200 |
| 2020 | $6,492 | $513,200 | $233,000 | $280,200 |
| 2019 | $6,051 | $456,000 | $221,900 | $234,100 |
| 2018 | $6,056 | $429,800 | $204,800 | $225,000 |
| 2017 | $5,885 | $415,300 | $196,300 | $219,000 |
| 2016 | $5,618 | $370,600 | $172,800 | $197,800 |
| 2015 | $5,601 | $356,100 | $164,300 | $191,800 |
| 2014 | $5,295 | $328,900 | $149,300 | $179,600 |
Source: Public Records
Map
Nearby Homes
- 31 Preston St
- 56 Rocky Nook Unit 56
- 47 Rocky Nook Unit 47
- 15 Mount Washington Ave
- 163 Sylvan St
- 141 Pierce St Unit 25
- 30 Wallace Cir
- 58 Clark St
- 46 Lebanon St
- 26 Webber St Unit 1
- 0 S Mountain Avenue & O Cargil
- 30 Franklin St Unit 105
- 241 Mountain Ave
- 7 Sawyer Ct
- 115 Webster St
- 42 Auburn St
- 14 Dodge St
- 48 Tremont St
- 45 Richardson St
- 23 Orient St