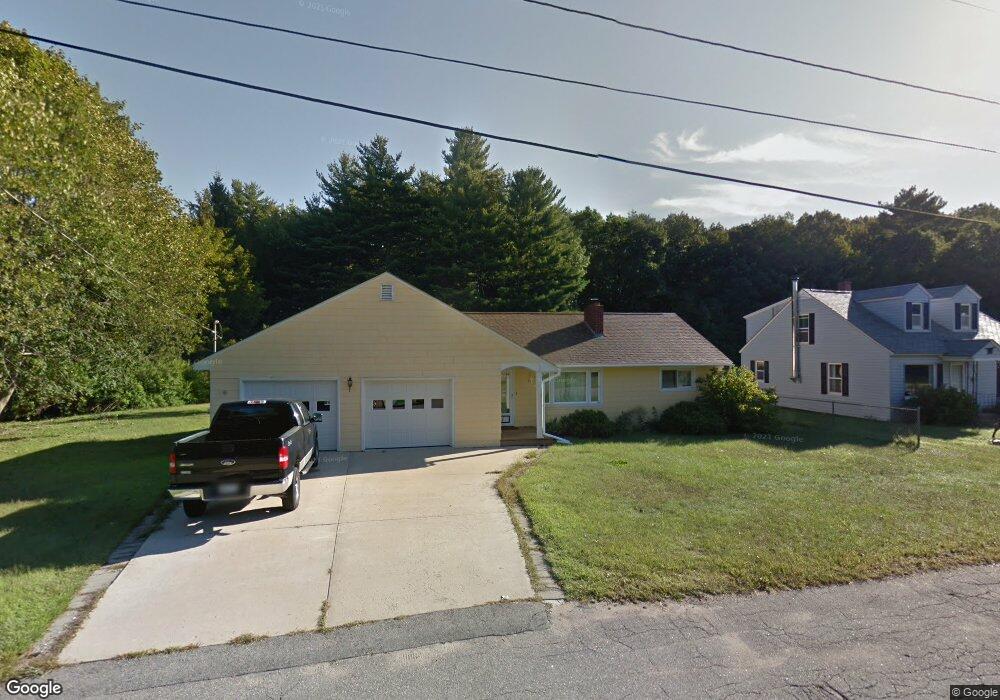
73 June St Sanford, ME 04073
Estimated Value: $325,599 - $377,000
2
Beds
1
Bath
1,040
Sq Ft
$333/Sq Ft
Est. Value
About This Home
This home is located at 73 June St, Sanford, ME 04073 and is currently estimated at $345,900, approximately $332 per square foot. 73 June St is a home located in York County with nearby schools including St Thomas Consolidated School and Sanford Christian Academy.
Ownership History
Date
Name
Owned For
Owner Type
Purchase Details
Closed on
Sep 1, 2010
Sold by
Taylor Fred H and Taylor Marguerite B
Bought by
Hanna David M
Current Estimated Value
Home Financials for this Owner
Home Financials are based on the most recent Mortgage that was taken out on this home.
Original Mortgage
$156,165
Outstanding Balance
$102,888
Interest Rate
4.55%
Mortgage Type
FHA
Estimated Equity
$243,012
Create a Home Valuation Report for This Property
The Home Valuation Report is an in-depth analysis detailing your home's value as well as a comparison with similar homes in the area
Home Values in the Area
Average Home Value in this Area
Purchase History
| Date | Buyer | Sale Price | Title Company |
|---|---|---|---|
| Hanna David M | -- | -- |
Source: Public Records
Mortgage History
| Date | Status | Borrower | Loan Amount |
|---|---|---|---|
| Open | Hanna David M | $156,165 |
Source: Public Records
Tax History Compared to Growth
Tax History
| Year | Tax Paid | Tax Assessment Tax Assessment Total Assessment is a certain percentage of the fair market value that is determined by local assessors to be the total taxable value of land and additions on the property. | Land | Improvement |
|---|---|---|---|---|
| 2025 | $4,030 | $235,700 | $44,800 | $190,900 |
| 2024 | $3,804 | $235,700 | $44,800 | $190,900 |
| 2023 | $3,538 | $233,700 | $44,800 | $188,900 |
| 2022 | $3,459 | $233,700 | $44,800 | $188,900 |
| 2021 | $3,416 | $187,900 | $44,800 | $143,100 |
| 2020 | $3,351 | $166,200 | $44,800 | $121,400 |
| 2019 | $3,227 | $155,900 | $44,800 | $111,100 |
| 2018 | $3,155 | $153,900 | $44,800 | $109,100 |
| 2017 | $3,047 | $146,900 | $44,800 | $102,100 |
| 2016 | $3,095 | $136,100 | $44,900 | $91,200 |
| 2015 | $2,854 | $139,500 | $49,400 | $90,100 |
| 2014 | $2,800 | $139,500 | $49,400 | $90,100 |
| 2013 | -- | $139,500 | $49,400 | $90,100 |
Source: Public Records
Map
Nearby Homes