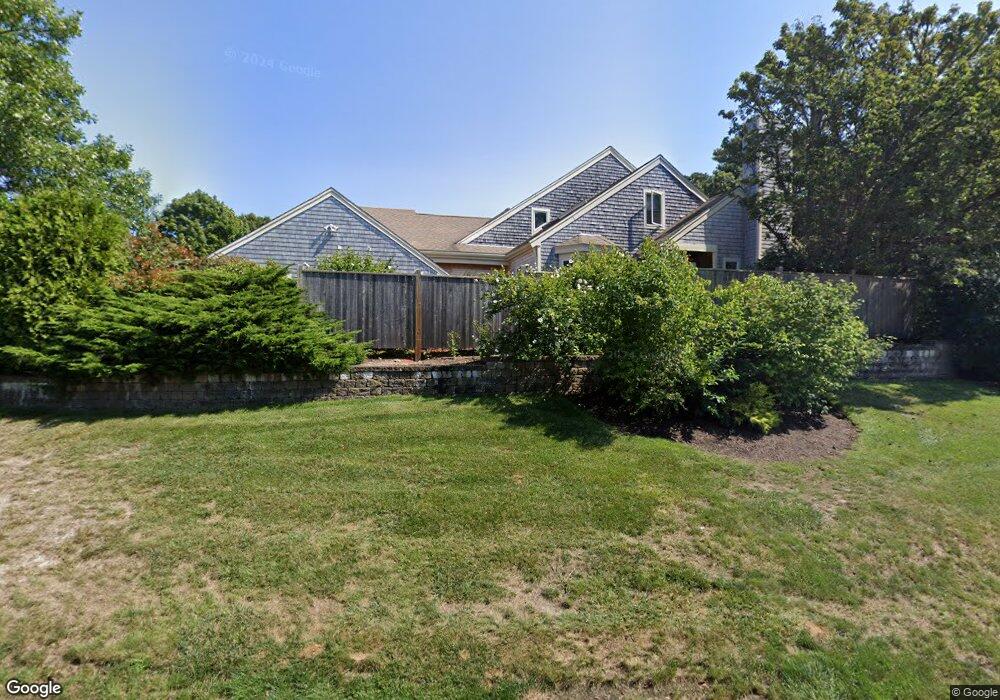
73 Kates Path Yarmouth Port, MA 02675
Yarmouth Port NeighborhoodEstimated Value: $621,000 - $771,000
3
Beds
4
Baths
1,616
Sq Ft
$421/Sq Ft
Est. Value
About This Home
This home is located at 73 Kates Path, Yarmouth Port, MA 02675 and is currently estimated at $680,701, approximately $421 per square foot. 73 Kates Path is a home located in Barnstable County with nearby schools including Dennis-Yarmouth Regional High School.
Ownership History
Date
Name
Owned For
Owner Type
Purchase Details
Closed on
Mar 4, 2025
Sold by
Kelly John L and Kelly Jo-Ann M
Bought by
John Kelly Cape Cod Ret and Kelly
Current Estimated Value
Purchase Details
Closed on
Aug 15, 2011
Sold by
Nelson Madlyn
Bought by
Mccarrick Paul B and Mccarrick Jane M
Purchase Details
Closed on
Apr 4, 2005
Sold by
Nelson Alfred A and Nelson Madlyn
Bought by
Nelson Madlyn
Home Financials for this Owner
Home Financials are based on the most recent Mortgage that was taken out on this home.
Original Mortgage
$300,000
Interest Rate
5.64%
Mortgage Type
Purchase Money Mortgage
Purchase Details
Closed on
Mar 16, 2005
Sold by
Boehler Alice M
Bought by
Nelson Alfred A and Nelson Madlyn
Home Financials for this Owner
Home Financials are based on the most recent Mortgage that was taken out on this home.
Original Mortgage
$300,000
Interest Rate
5.64%
Mortgage Type
Purchase Money Mortgage
Purchase Details
Closed on
Oct 15, 1997
Sold by
Devries Mary L
Bought by
Boehler Alice M
Purchase Details
Closed on
Sep 27, 1991
Sold by
The Green Co Inc
Bought by
Devries Mary L
Create a Home Valuation Report for This Property
The Home Valuation Report is an in-depth analysis detailing your home's value as well as a comparison with similar homes in the area
Home Values in the Area
Average Home Value in this Area
Purchase History
| Date | Buyer | Sale Price | Title Company |
|---|---|---|---|
| John Kelly Cape Cod Ret | -- | None Available | |
| Mccarrick Paul B | $340,000 | -- | |
| Mccarrick Paul B | $340,000 | -- | |
| Nelson Madlyn | -- | -- | |
| Nelson Madlyn | -- | -- | |
| Nelson Alfred A | $523,000 | -- | |
| Boehler Alice M | $215,000 | -- | |
| Boehler Alice M | $215,000 | -- | |
| Devries Mary L | $210,000 | -- | |
| Devries Mary L | $210,000 | -- |
Source: Public Records
Mortgage History
| Date | Status | Borrower | Loan Amount |
|---|---|---|---|
| Previous Owner | Devries Mary L | $300,000 |
Source: Public Records
Tax History Compared to Growth
Tax History
| Year | Tax Paid | Tax Assessment Tax Assessment Total Assessment is a certain percentage of the fair market value that is determined by local assessors to be the total taxable value of land and additions on the property. | Land | Improvement |
|---|---|---|---|---|
| 2025 | $3,879 | $547,900 | $0 | $547,900 |
| 2024 | $4,442 | $601,900 | $0 | $601,900 |
| 2023 | $3,354 | $413,600 | $0 | $413,600 |
| 2022 | $4,207 | $458,300 | $0 | $458,300 |
| 2021 | $4,096 | $428,400 | $0 | $428,400 |
| 2020 | $3,946 | $394,600 | $0 | $394,600 |
| 2019 | $3,704 | $366,700 | $0 | $366,700 |
| 2018 | $3,485 | $338,700 | $0 | $338,700 |
| 2017 | $3,254 | $324,800 | $0 | $324,800 |
| 2016 | $3,102 | $310,800 | $0 | $310,800 |
| 2015 | $3,192 | $317,900 | $0 | $317,900 |
Source: Public Records
Map
Nearby Homes
- 228 Kates Path
- 17 Kates Path Unit A
- 34 Kates Path
- 34 Kates Path Unit 34
- 64 Kates Path
- 50 John Hall Cartway
- 50 John Hall Cartway Unit 50
- 42 John Hall Cartway Unit 42
- 43 Canterbury Rd
- 7 Forest Gate Unit 7
- 44 Stratford Ln
- 25 Oak Glen Village Unit 25
- 25 Oak Glen
- 30 W Woods
- 30 W Woods Cir Unit 30
- 2 Pine Grove
- 86 Pompano Rd
- 51 Bray Farm Rd N
- 6 Nimble Hill Dr
- 1 Barnacle Rd
- 136 Kates Path Unit C
- 246 Kates Path
- 244 Kates Path
- 234 Kates Path
- 232 Kates Path
- 230 Kates Path
- 224 Kates Path
- 222 Kates Path
- 220 Kates Path
- 218 Kates Path
- 214 Kates Path
- 212 Kates Path
- 138 Kates Path
- 136 Kates Path
- 134 Kates Path
- 132 Kates Path
- 130 Kates Path
- 77 Kates Path
- 75 Kates Path
- 71 Kates Path