Estimated Value: $80,996 - $273,000
3
Beds
2
Baths
1,490
Sq Ft
$105/Sq Ft
Est. Value
About This Home
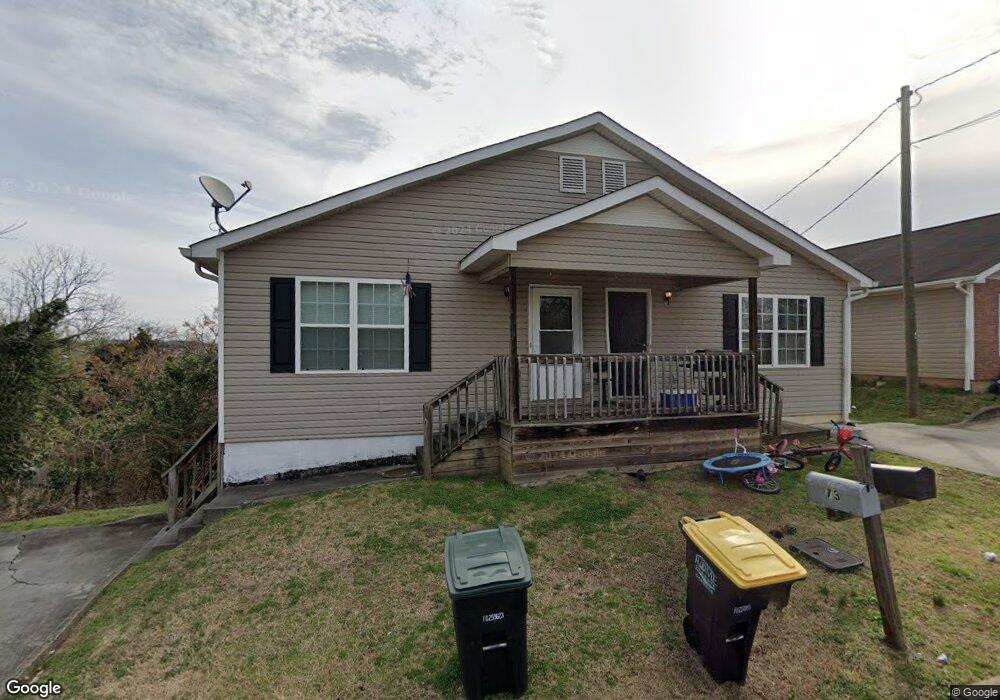
This home is located at 73 Klassing St SW, Rome, GA 30161 and is currently estimated at $156,249, approximately $104 per square foot. 73 Klassing St SW is a home located in Floyd County with nearby schools including Dan McCarty Middle School, Rome High School, and Darlington School.
Ownership History
Date
Name
Owned For
Owner Type
Purchase Details
Closed on
Jun 24, 2009
Sold by
Structured Asset Securitie
Bought by
Mossy Ridge Real
Current Estimated Value
Purchase Details
Closed on
Jan 2, 2008
Sold by
Not Provided
Bought by
Mossy Ridge Real
Purchase Details
Closed on
Jun 13, 2005
Bought by
P and R
Purchase Details
Closed on
Dec 29, 2000
Sold by
Monford Bessie
Bought by
Monford Herbert
Purchase Details
Closed on
Sep 25, 1990
Sold by
Monford Byron F
Bought by
Monford Bessie
Purchase Details
Closed on
Nov 1, 1978
Sold by
Clemons W M
Bought by
Monford Byron F
Purchase Details
Closed on
Jan 1, 1901
Bought by
Clemons W M
Create a Home Valuation Report for This Property
The Home Valuation Report is an in-depth analysis detailing your home's value as well as a comparison with similar homes in the area
Home Values in the Area
Average Home Value in this Area
Purchase History
| Date | Buyer | Sale Price | Title Company |
|---|---|---|---|
| Mossy Ridge Real | $32,000 | -- | |
| Mossy Ridge Real | $109,225 | -- | |
| Us Bank National Association | $109,225 | -- | |
| P | -- | -- | |
| Monford Herbert | -- | -- | |
| Monford Bessie | -- | -- | |
| Monford Byron F | $7,000 | -- | |
| Clemons W M | -- | -- |
Source: Public Records
Tax History Compared to Growth
Tax History
| Year | Tax Paid | Tax Assessment Tax Assessment Total Assessment is a certain percentage of the fair market value that is determined by local assessors to be the total taxable value of land and additions on the property. | Land | Improvement |
|---|---|---|---|---|
| 2024 | $2,693 | $40,336 | $3,605 | $36,731 |
| 2023 | $1,428 | $40,336 | $3,605 | $36,731 |
| 2022 | $1,251 | $40,336 | $3,485 | $36,851 |
| 2021 | $1,294 | $34,879 | $3,485 | $31,394 |
| 2020 | $1,222 | $32,658 | $2,722 | $29,936 |
| 2019 | $1,154 | $31,172 | $2,722 | $28,450 |
| 2018 | $1,047 | $28,280 | $2,722 | $25,558 |
| 2017 | $1,019 | $27,536 | $2,722 | $24,814 |
| 2016 | $1,008 | $27,134 | $2,720 | $24,414 |
| 2015 | $952 | $27,134 | $2,720 | $24,414 |
| 2014 | $952 | $27,134 | $2,720 | $24,414 |
Source: Public Records
Map
Nearby Homes
- 105 Mary St SW
- 232 S Broad St SW
- 110 Cherokee St SW
- 235 Pennington Ave SW
- 204 Myrtle St SW
- 334 Branham Ave SW
- 101 Hardy Ave SW
- 107 Butler St SW
- 515 S Broad St SW
- 515 Harper Ave SW
- 3 Grover St SW
- 115 Lookout Cir SW
- 113 Lookout Cir SW
- 410 Hardy Ave SW
- 111 Lookout Cir SW
- 8 E 3rd Ave
- 10 E 3rd Ave
- 218 Wilson Ave SW
- 515 Hardy Ave SW
- 75 Klassing St SW
- 77 Klassing St SW
- 77 Klassing St SW
- 9 Klassing St SW
- 81 Klassing St SW
- 200 Broad St Unit 201
- 7 Klassing St SW
- 5 Myrtle St SW
- 12 Klassing St SW
- 114 Mary St SW
- 210 S Broad St SW
- 7 Myrtle St SW
- 5 Klassing St SW
- 10 Klassing St SW
- 107 Mary St SW
- 212 S Broad St SW
- 0 Mary St
- 8 Klassing St SW
- 11 Myrtle St SW
- 212 & 214 S Broad St SW