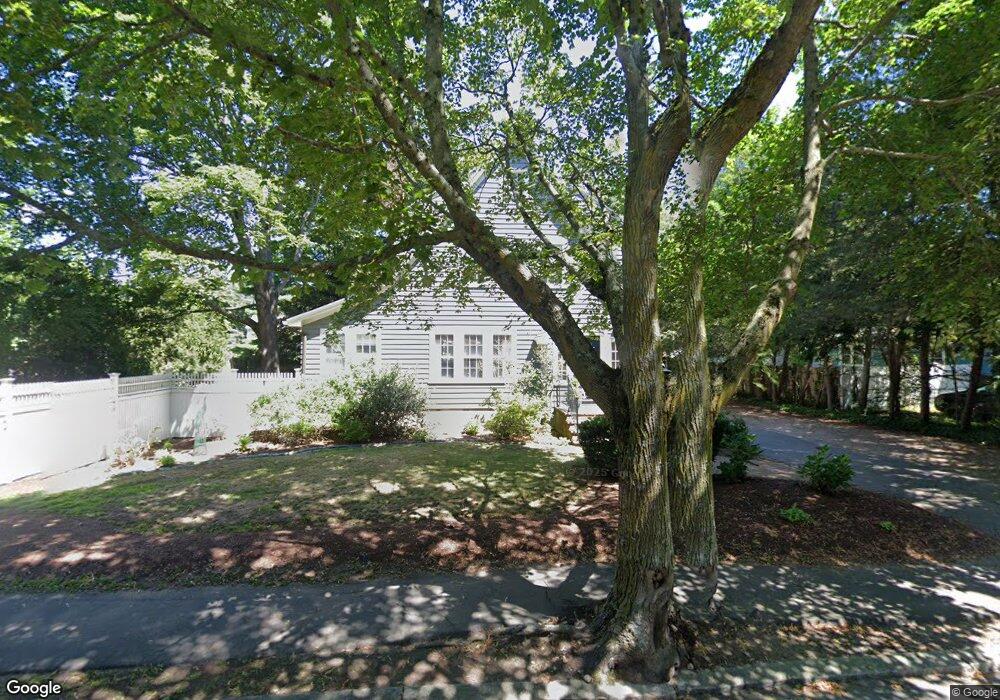
73 Lafayette St Marblehead, MA 01945
Estimated Value: $1,051,829 - $1,181,000
4
Beds
3
Baths
2,475
Sq Ft
$459/Sq Ft
Est. Value
About This Home
This home is located at 73 Lafayette St, Marblehead, MA 01945 and is currently estimated at $1,135,707, approximately $458 per square foot. 73 Lafayette St is a home located in Essex County with nearby schools including Marblehead High School, Tower School, and Devereux School.
Ownership History
Date
Name
Owned For
Owner Type
Purchase Details
Closed on
Oct 27, 2006
Sold by
Nolden Igst Nt
Bought by
Ferrucci Michael A
Current Estimated Value
Home Financials for this Owner
Home Financials are based on the most recent Mortgage that was taken out on this home.
Original Mortgage
$520,000
Outstanding Balance
$312,231
Interest Rate
6.48%
Mortgage Type
Purchase Money Mortgage
Estimated Equity
$823,476
Purchase Details
Closed on
May 14, 1999
Sold by
Sheridan 1997
Bought by
Nolden Igst Nt
Create a Home Valuation Report for This Property
The Home Valuation Report is an in-depth analysis detailing your home's value as well as a comparison with similar homes in the area
Home Values in the Area
Average Home Value in this Area
Purchase History
| Date | Buyer | Sale Price | Title Company |
|---|---|---|---|
| Ferrucci Michael A | $650,000 | -- | |
| Ferrucci Michael A | $650,000 | -- | |
| Nolden Igst Nt | $429,000 | -- | |
| Nolden Igst Nt | $429,000 | -- |
Source: Public Records
Mortgage History
| Date | Status | Borrower | Loan Amount |
|---|---|---|---|
| Open | Nolden Igst Nt | $520,000 | |
| Closed | Nolden Igst Nt | $65,000 |
Source: Public Records
Tax History Compared to Growth
Tax History
| Year | Tax Paid | Tax Assessment Tax Assessment Total Assessment is a certain percentage of the fair market value that is determined by local assessors to be the total taxable value of land and additions on the property. | Land | Improvement |
|---|---|---|---|---|
| 2025 | $8,959 | $989,900 | $600,000 | $389,900 |
| 2024 | $8,269 | $922,900 | $540,000 | $382,900 |
| 2023 | $8,550 | $855,000 | $540,000 | $315,000 |
| 2022 | $7,950 | $755,700 | $450,000 | $305,700 |
| 2021 | $7,537 | $723,300 | $420,000 | $303,300 |
| 2020 | $7,505 | $722,300 | $450,000 | $272,300 |
| 2019 | $7,435 | $692,300 | $420,000 | $272,300 |
| 2018 | $7,133 | $647,300 | $375,000 | $272,300 |
| 2017 | $6,466 | $587,300 | $315,000 | $272,300 |
| 2016 | $6,134 | $552,600 | $285,000 | $267,600 |
| 2015 | $6,275 | $566,300 | $300,000 | $266,300 |
| 2014 | $5,872 | $529,500 | $270,000 | $259,500 |
Source: Public Records
Map
Nearby Homes
- 8 Old Salem Rd
- 4 Dean Rd
- 30 Amherst Rd
- 25 Tedesco St
- 11 Angenica Terrace
- 282 Pleasant St
- 201 Humphrey St Unit 2
- 212 Humphrey St Unit 205
- 70 Maverick St
- 4 Gallison Ave
- 48 Bellevue Rd
- 100 Village St
- 34 Moffatt Rd
- 179 Beach Bluff Ave
- 27 Village St Unit 1
- 37 Stanley Rd
- 23 Wyman Rd
- 106 Broadway Unit 3
- 10 Quadrant Rd
- 24 Wisteria St Unit 2