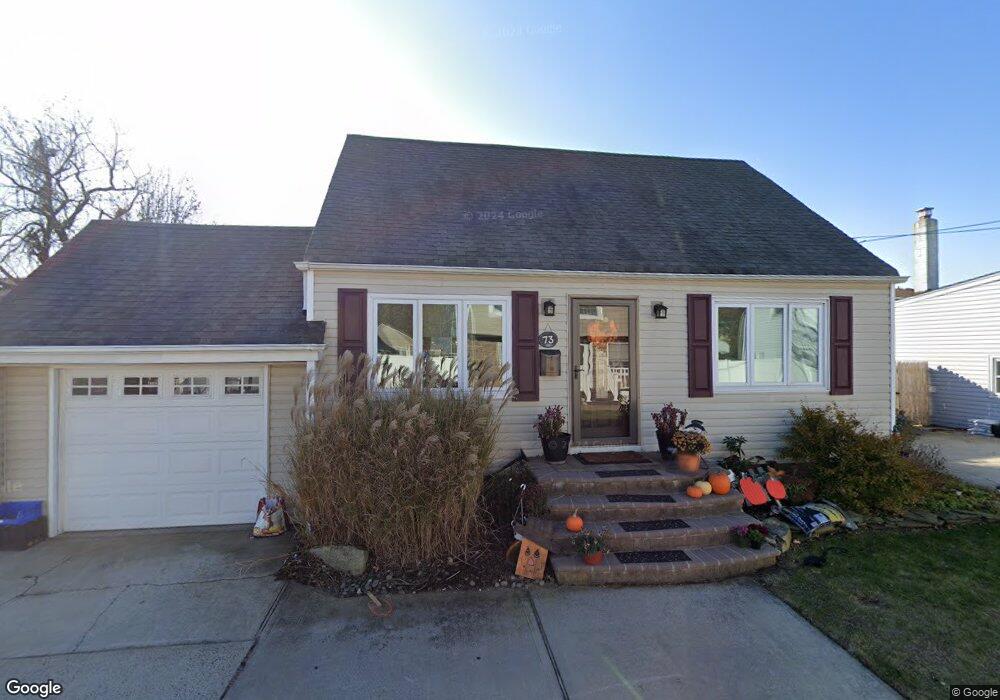
73 Lake St Lindenhurst, NY 11757
Estimated Value: $545,000 - $644,000
--
Bed
--
Bath
744
Sq Ft
$794/Sq Ft
Est. Value
About This Home
This home is located at 73 Lake St, Lindenhurst, NY 11757 and is currently estimated at $590,365, approximately $793 per square foot. 73 Lake St is a home located in Suffolk County with nearby schools including Harding Avenue Elementary School, Lindenhurst Middle School, and Lindenhurst Senior High School.
Ownership History
Date
Name
Owned For
Owner Type
Purchase Details
Closed on
Sep 10, 2007
Sold by
Urbom John
Bought by
Messler Micheline
Current Estimated Value
Purchase Details
Closed on
Oct 20, 2003
Sold by
Moran Cindy and Greenstein Madeline
Bought by
Moran Cindy
Purchase Details
Closed on
Jan 24, 2000
Sold by
Dubreuil Joseph L and Dubreuil Scott
Bought by
Moran Cindy and Greenstein Madeline
Home Financials for this Owner
Home Financials are based on the most recent Mortgage that was taken out on this home.
Original Mortgage
$148,924
Interest Rate
7.91%
Mortgage Type
FHA
Purchase Details
Closed on
Jan 28, 1999
Sold by
Port Realty Group Llc
Bought by
Dubrevil Joseph L and Dubrevil Scott
Purchase Details
Closed on
Dec 31, 1998
Sold by
Chase Manhattan Bank
Bought by
Port Realty Group Llc
Purchase Details
Closed on
Nov 22, 1998
Sold by
Maricic Joyce
Bought by
Chase Manhattan Bank
Create a Home Valuation Report for This Property
The Home Valuation Report is an in-depth analysis detailing your home's value as well as a comparison with similar homes in the area
Home Values in the Area
Average Home Value in this Area
Purchase History
| Date | Buyer | Sale Price | Title Company |
|---|---|---|---|
| Messler Micheline | $349,500 | Deborah Fairbrother | |
| Moran Cindy | -- | -- | |
| Moran Cindy | $149,500 | -- | |
| Dubrevil Joseph L | $87,000 | -- | |
| Port Realty Group Llc | $77,500 | Titleguard | |
| Chase Manhattan Bank | $61,000 | Titleguard |
Source: Public Records
Mortgage History
| Date | Status | Borrower | Loan Amount |
|---|---|---|---|
| Previous Owner | Moran Cindy | $148,924 |
Source: Public Records
Tax History Compared to Growth
Tax History
| Year | Tax Paid | Tax Assessment Tax Assessment Total Assessment is a certain percentage of the fair market value that is determined by local assessors to be the total taxable value of land and additions on the property. | Land | Improvement |
|---|---|---|---|---|
| 2024 | $6,225 | $1,900 | $140 | $1,760 |
| 2023 | $5,425 | $1,900 | $140 | $1,760 |
| 2022 | $4,512 | $1,900 | $140 | $1,760 |
| 2021 | $4,512 | $1,900 | $140 | $1,760 |
| 2020 | $4,759 | $1,900 | $140 | $1,760 |
| 2019 | $5,473 | $0 | $0 | $0 |
| 2018 | $4,389 | $1,900 | $140 | $1,760 |
| 2017 | $4,389 | $1,900 | $140 | $1,760 |
| 2016 | $4,425 | $1,900 | $140 | $1,760 |
| 2015 | -- | $1,900 | $140 | $1,760 |
| 2014 | -- | $1,900 | $140 | $1,760 |
Source: Public Records
Map
Nearby Homes