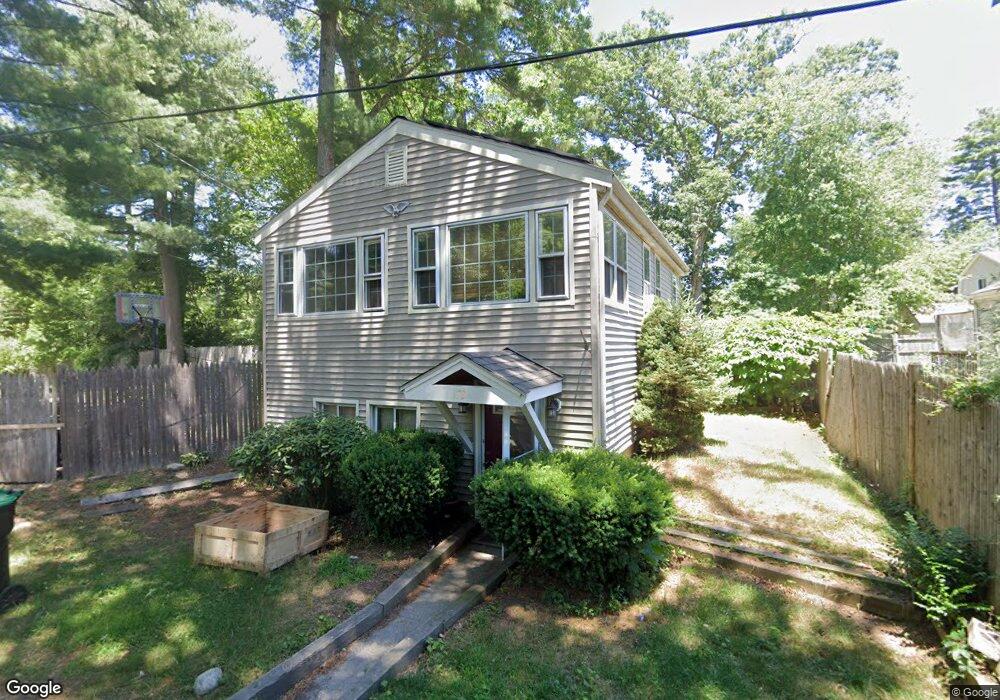
73 Leon Ct Hanson, MA 02341
Estimated Value: $335,000 - $468,000
3
Beds
2
Baths
615
Sq Ft
$638/Sq Ft
Est. Value
About This Home
This home is located at 73 Leon Ct, Hanson, MA 02341 and is currently estimated at $392,108, approximately $637 per square foot. 73 Leon Ct is a home.
Ownership History
Date
Name
Owned For
Owner Type
Purchase Details
Closed on
Jul 11, 2019
Sold by
Leighton Daniela and Leighton David
Bought by
Leighton David
Current Estimated Value
Home Financials for this Owner
Home Financials are based on the most recent Mortgage that was taken out on this home.
Original Mortgage
$230,000
Outstanding Balance
$200,633
Interest Rate
3.82%
Mortgage Type
New Conventional
Estimated Equity
$191,475
Purchase Details
Closed on
May 31, 2001
Sold by
Byron Mark P and Byron Diane M
Bought by
Leighton David and Neculescu Mihail
Create a Home Valuation Report for This Property
The Home Valuation Report is an in-depth analysis detailing your home's value as well as a comparison with similar homes in the area
Home Values in the Area
Average Home Value in this Area
Purchase History
| Date | Buyer | Sale Price | Title Company |
|---|---|---|---|
| Leighton David | -- | -- | |
| Leighton David | $164,900 | -- |
Source: Public Records
Mortgage History
| Date | Status | Borrower | Loan Amount |
|---|---|---|---|
| Open | Leighton David | $230,000 | |
| Previous Owner | Leighton David | $178,450 | |
| Previous Owner | Leighton David | $11,500 | |
| Previous Owner | Leighton David | $205,000 |
Source: Public Records
Tax History Compared to Growth
Tax History
| Year | Tax Paid | Tax Assessment Tax Assessment Total Assessment is a certain percentage of the fair market value that is determined by local assessors to be the total taxable value of land and additions on the property. | Land | Improvement |
|---|---|---|---|---|
| 2025 | $3,322 | $248,300 | $141,900 | $106,400 |
| 2024 | $3,258 | $243,500 | $137,800 | $105,700 |
| 2023 | $3,290 | $232,000 | $137,800 | $94,200 |
| 2022 | $3,279 | $217,300 | $125,300 | $92,000 |
| 2021 | $2,954 | $195,600 | $120,500 | $75,100 |
| 2020 | $2,909 | $190,500 | $116,400 | $74,100 |
| 2019 | $2,732 | $175,900 | $107,000 | $68,900 |
| 2018 | $2,699 | $170,500 | $102,900 | $67,600 |
| 2017 | $2,512 | $157,200 | $91,500 | $65,700 |
| 2016 | $2,577 | $155,700 | $91,500 | $64,200 |
| 2015 | $2,507 | $157,500 | $91,500 | $66,000 |
Source: Public Records
Map
Nearby Homes