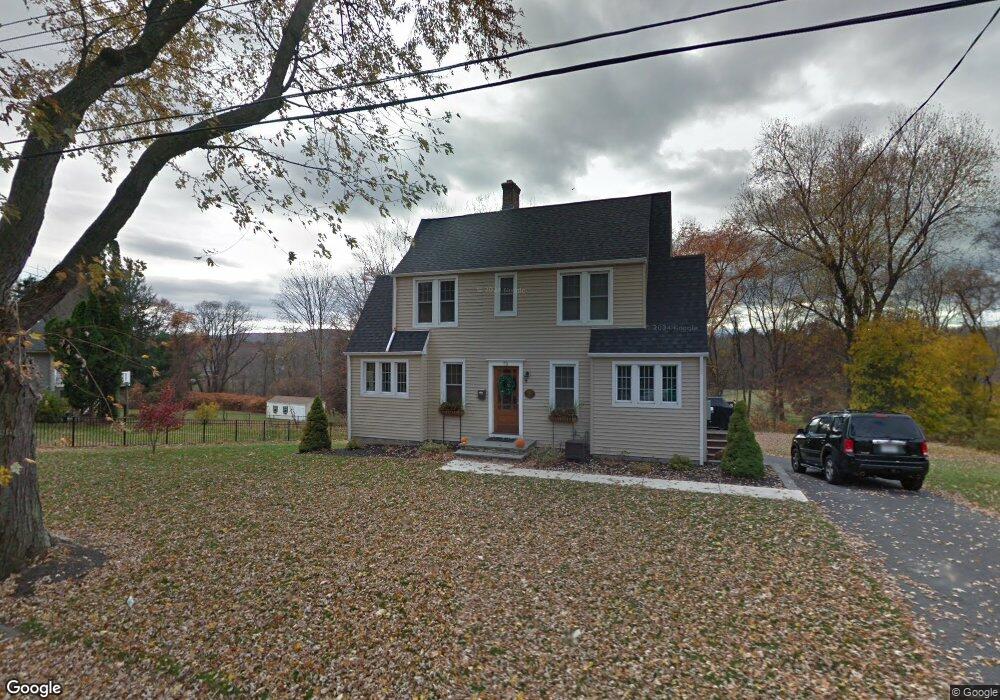
73 Lower Beverly Hills West Springfield, MA 01089
Estimated Value: $358,612 - $432,000
3
Beds
1
Bath
1,628
Sq Ft
$241/Sq Ft
Est. Value
About This Home
This home is located at 73 Lower Beverly Hills, West Springfield, MA 01089 and is currently estimated at $392,403, approximately $241 per square foot. 73 Lower Beverly Hills is a home located in Hampden County with nearby schools including St Thomas The Apostle School.
Ownership History
Date
Name
Owned For
Owner Type
Purchase Details
Closed on
Jun 28, 2007
Sold by
Brayton Craig and Mastroianni Mark G
Bought by
Senecal Dina and Senecal Martin
Current Estimated Value
Home Financials for this Owner
Home Financials are based on the most recent Mortgage that was taken out on this home.
Original Mortgage
$232,800
Interest Rate
6.24%
Mortgage Type
Purchase Money Mortgage
Purchase Details
Closed on
Jan 19, 2007
Sold by
Kania-Nicholson Jadwica H and Milweski David
Bought by
Kania Stanley J
Create a Home Valuation Report for This Property
The Home Valuation Report is an in-depth analysis detailing your home's value as well as a comparison with similar homes in the area
Home Values in the Area
Average Home Value in this Area
Purchase History
| Date | Buyer | Sale Price | Title Company |
|---|---|---|---|
| Senecal Dina | $240,000 | -- | |
| Kania Stanley J | -- | -- | |
| Senecal Dina | $240,000 | -- | |
| Kania Stanley J | -- | -- |
Source: Public Records
Mortgage History
| Date | Status | Borrower | Loan Amount |
|---|---|---|---|
| Open | Kania Stanley J | $217,500 | |
| Closed | Senecal Dina | $232,800 |
Source: Public Records
Tax History Compared to Growth
Tax History
| Year | Tax Paid | Tax Assessment Tax Assessment Total Assessment is a certain percentage of the fair market value that is determined by local assessors to be the total taxable value of land and additions on the property. | Land | Improvement |
|---|---|---|---|---|
| 2025 | $4,430 | $297,900 | $110,000 | $187,900 |
| 2024 | $4,172 | $281,700 | $110,000 | $171,700 |
| 2023 | $3,964 | $255,100 | $110,000 | $145,100 |
| 2022 | $3,581 | $227,200 | $99,800 | $127,400 |
| 2021 | $3,617 | $214,000 | $95,000 | $119,000 |
| 2020 | $3,316 | $195,200 | $95,000 | $100,200 |
| 2019 | $3,311 | $195,200 | $95,000 | $100,200 |
| 2018 | $3,328 | $195,200 | $95,000 | $100,200 |
| 2017 | $3,328 | $195,200 | $95,000 | $100,200 |
| 2016 | $3,215 | $189,200 | $91,400 | $97,800 |
| 2015 | $3,153 | $185,600 | $89,600 | $96,000 |
| 2014 | $765 | $185,600 | $89,600 | $96,000 |
Source: Public Records
Map
Nearby Homes
- 139 Upper Beverly Hills
- 180 Wolcott Ave
- 260 Wolcott Ave
- 148 Craiwell Ave
- 258 Poplar Ave
- 43 Houston Rd
- 416 Hillcrest Ave
- 16 North St
- 514 Dewey St
- 31 Stone Path Ln
- 65 Verdugo St
- 283 Forest Glen
- 8 Ridgeview Dr
- 142 Morton St
- 42 Janet St
- 19 Cora St
- 61 Clarence St
- 0 E Mountain Rd
- 189 Springfield Rd Unit 23
- 719 N West St
- 83 Lower Beverly Hills
- 57 Lower Beverly Hills
- 72 Lower Beverly Hills
- 60 Lower Beverly Hills
- 91 Lower Beverly Hills
- 88 Lower Beverly Hills
- 53 Upper Beverly Hills
- 49 Lower Beverly Hills
- 45 Upper Beverly Hills
- 37 Upper Beverly Hills
- 97 Lower Beverly Hills
- 97 Beverly Hills Low
- 48 Lower Beverly Hills
- 98 Lower Beverly Hills
- 57 Upper Beverly Hills
- 27 Upper Beverly Hills
- 41 Lower Beverly Hills
- 63 Upper Beverly Hills
- 103 Lower Beverly Hills
- 42 Lower Beverly Hills