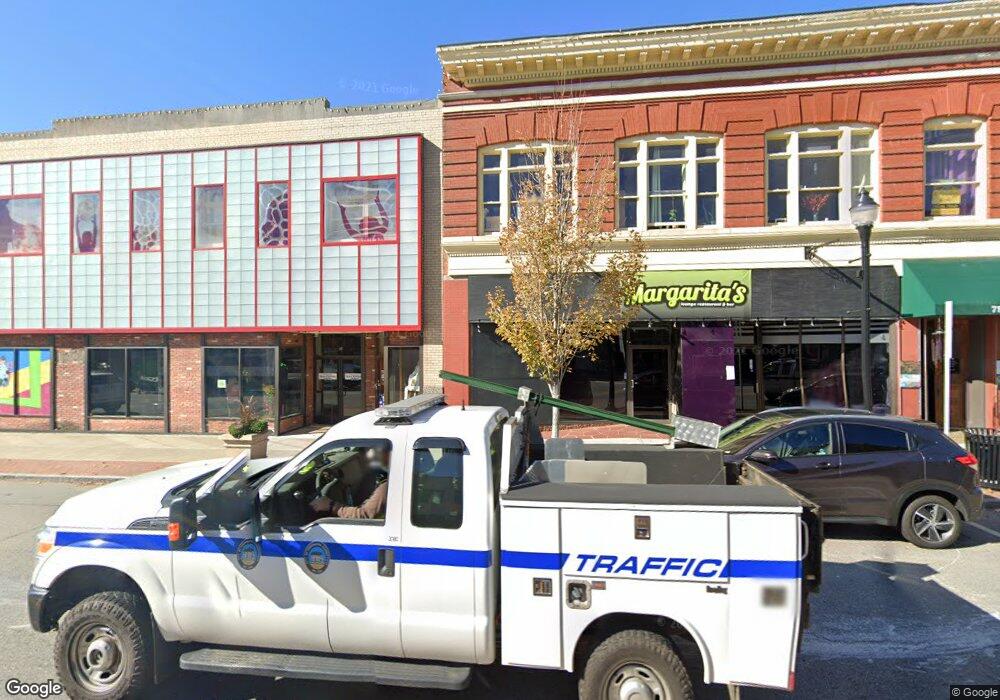
73 Main St Torrington, CT 06790
Estimated Value: $594,432
--
Bed
--
Bath
8,060
Sq Ft
$74/Sq Ft
Est. Value
About This Home
This home is located at 73 Main St, Torrington, CT 06790 and is currently estimated at $594,432, approximately $73 per square foot. 73 Main St is a home located in Litchfield County with nearby schools including Torrington Middle School and Torrington High School.
Ownership History
Date
Name
Owned For
Owner Type
Purchase Details
Closed on
Dec 5, 2011
Sold by
75 East Main Street Ll
Bought by
Injs Llc
Current Estimated Value
Home Financials for this Owner
Home Financials are based on the most recent Mortgage that was taken out on this home.
Original Mortgage
$170,000
Interest Rate
4.1%
Mortgage Type
Commercial
Purchase Details
Closed on
Dec 16, 2009
Sold by
75 E Main Street Llc
Bought by
Tagsaleguys Llc
Home Financials for this Owner
Home Financials are based on the most recent Mortgage that was taken out on this home.
Original Mortgage
$242,500
Interest Rate
9.5%
Mortgage Type
Commercial
Create a Home Valuation Report for This Property
The Home Valuation Report is an in-depth analysis detailing your home's value as well as a comparison with similar homes in the area
Home Values in the Area
Average Home Value in this Area
Purchase History
| Date | Buyer | Sale Price | Title Company |
|---|---|---|---|
| Injs Llc | $250,000 | -- | |
| Tagsaleguys Llc | $262,500 | -- |
Source: Public Records
Mortgage History
| Date | Status | Borrower | Loan Amount |
|---|---|---|---|
| Open | Tagsaleguys Llc | $133,765 | |
| Closed | Tagsaleguys Llc | $170,000 | |
| Previous Owner | Tagsaleguys Llc | $242,500 |
Source: Public Records
Tax History Compared to Growth
Tax History
| Year | Tax Paid | Tax Assessment Tax Assessment Total Assessment is a certain percentage of the fair market value that is determined by local assessors to be the total taxable value of land and additions on the property. | Land | Improvement |
|---|---|---|---|---|
| 2025 | $17,010 | $442,400 | $45,360 | $397,040 |
| 2024 | $12,418 | $258,870 | $39,980 | $218,890 |
| 2023 | $12,415 | $258,870 | $39,980 | $218,890 |
| 2022 | $12,203 | $258,870 | $39,980 | $218,890 |
| 2021 | $11,952 | $258,870 | $39,980 | $218,890 |
| 2020 | $11,952 | $258,870 | $39,980 | $218,890 |
| 2019 | $10,601 | $229,610 | $38,240 | $191,370 |
| 2018 | $10,601 | $229,610 | $38,240 | $191,370 |
| 2017 | $10,505 | $229,610 | $38,240 | $191,370 |
| 2016 | $10,505 | $229,610 | $38,240 | $191,370 |
| 2015 | $10,505 | $229,610 | $38,240 | $191,370 |
| 2014 | $9,985 | $274,920 | $49,970 | $224,950 |
Source: Public Records
Map
Nearby Homes
- 82 Water St
- 7 George St
- 19 Harwinton Ave
- 291 E Main St
- 48 Brookside Ave
- 279 Main St
- 107 E Pearl St
- 25 Lipton Place
- 184 Harwinton Ave
- 271 S Main St
- 148 Hillside Ave
- 187 Hillside Ave
- 333 Hillside Ave Unit 10
- 185 Albert St
- 37 Linden St
- 17 Prospect Place
- 482 Main St
- 183 Brightwood Ave
- 21 Roosevelt Ave
- 112 French St