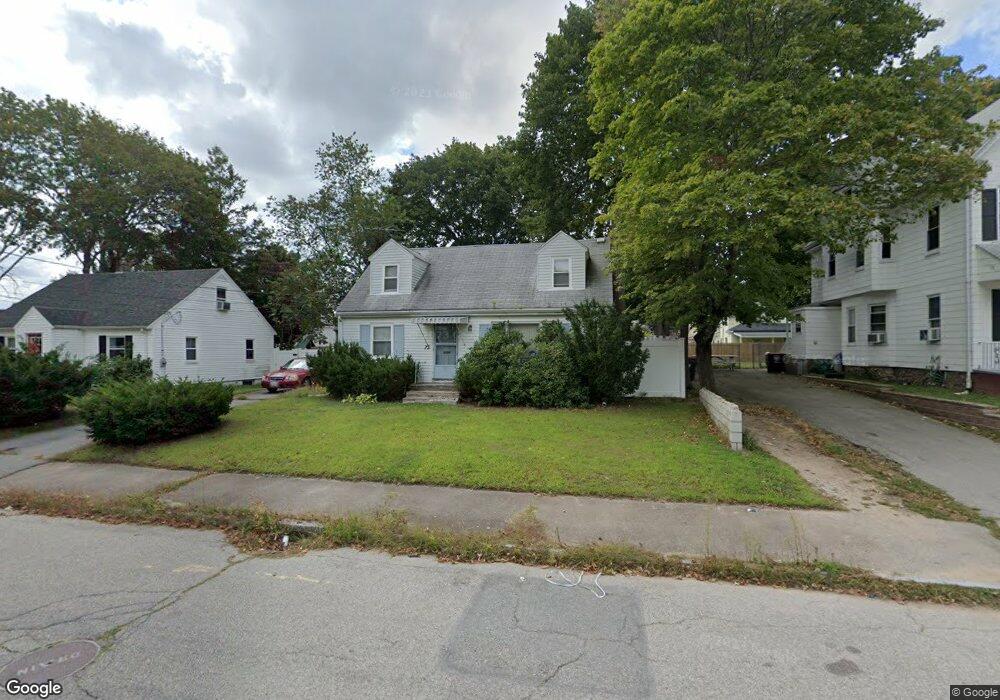
73 Malvern Rd Brockton, MA 02301
Estimated Value: $487,000 - $511,000
3
Beds
2
Baths
1,344
Sq Ft
$374/Sq Ft
Est. Value
About This Home
This home is located at 73 Malvern Rd, Brockton, MA 02301 and is currently estimated at $503,242, approximately $374 per square foot. 73 Malvern Rd is a home located in Plymouth County with nearby schools including Louis F Angelo Elementary School, Raymond K-8 Elementary School, and Hancock Elementary School.
Ownership History
Date
Name
Owned For
Owner Type
Purchase Details
Closed on
Nov 17, 2009
Sold by
Ganthier Ronald and Ganthier Nancy Jeannite
Bought by
Harper Lenay
Current Estimated Value
Home Financials for this Owner
Home Financials are based on the most recent Mortgage that was taken out on this home.
Original Mortgage
$186,148
Outstanding Balance
$121,423
Interest Rate
4.98%
Mortgage Type
Purchase Money Mortgage
Estimated Equity
$381,819
Purchase Details
Closed on
Dec 27, 1999
Sold by
Chao Patrick and Diep Ngoc
Bought by
Ganthier Ronald and Ganthier Nancy J
Purchase Details
Closed on
May 18, 1994
Sold by
Quadri Richard D and Quadri Claire G
Bought by
Chao Patrick and Diep Ngoc
Purchase Details
Closed on
May 15, 1987
Sold by
Gillis Patrick J
Bought by
Quadri Richard D
Create a Home Valuation Report for This Property
The Home Valuation Report is an in-depth analysis detailing your home's value as well as a comparison with similar homes in the area
Home Values in the Area
Average Home Value in this Area
Purchase History
| Date | Buyer | Sale Price | Title Company |
|---|---|---|---|
| Harper Lenay | $192,900 | -- | |
| Ganthier Ronald | $128,900 | -- | |
| Chao Patrick | $91,000 | -- | |
| Quadri Richard D | $125,000 | -- |
Source: Public Records
Mortgage History
| Date | Status | Borrower | Loan Amount |
|---|---|---|---|
| Open | Quadri Richard D | $186,148 | |
| Previous Owner | Quadri Richard D | $115,800 | |
| Previous Owner | Quadri Richard D | $2,500 |
Source: Public Records
Tax History Compared to Growth
Tax History
| Year | Tax Paid | Tax Assessment Tax Assessment Total Assessment is a certain percentage of the fair market value that is determined by local assessors to be the total taxable value of land and additions on the property. | Land | Improvement |
|---|---|---|---|---|
| 2025 | $5,241 | $432,800 | $143,500 | $289,300 |
| 2024 | $5,145 | $428,000 | $143,500 | $284,500 |
| 2023 | $4,943 | $380,800 | $108,000 | $272,800 |
| 2022 | $4,933 | $353,100 | $98,000 | $255,100 |
| 2021 | $4,482 | $309,100 | $89,200 | $219,900 |
| 2020 | $4,237 | $279,700 | $85,800 | $193,900 |
| 2019 | $4,057 | $261,100 | $78,700 | $182,400 |
| 2018 | $3,641 | $226,700 | $78,700 | $148,000 |
| 2017 | $3,668 | $227,800 | $78,700 | $149,100 |
| 2016 | $3,331 | $191,900 | $71,200 | $120,700 |
| 2015 | $3,160 | $174,100 | $71,200 | $102,900 |
| 2014 | $3,024 | $166,800 | $71,200 | $95,600 |
Source: Public Records
Map
Nearby Homes