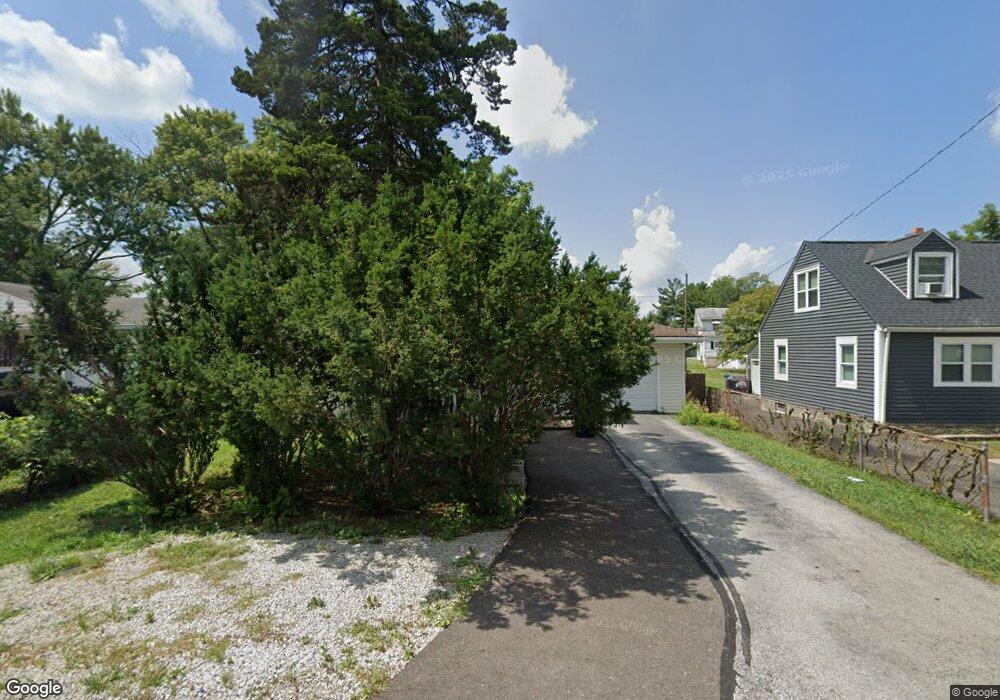
73 Maple Dr Columbus, OH 43228
Estimated Value: $172,260 - $209,000
2
Beds
2
Baths
792
Sq Ft
$236/Sq Ft
Est. Value
About This Home
This home is located at 73 Maple Dr, Columbus, OH 43228 and is currently estimated at $186,815, approximately $235 per square foot. 73 Maple Dr is a home located in Franklin County with nearby schools including Prairie Lincoln Elementary School, Galloway Ridge Intermediate School, and Norton Middle School.
Ownership History
Date
Name
Owned For
Owner Type
Purchase Details
Closed on
May 6, 2020
Sold by
Khadzhayev Dmytro and Khadzhayev Svitlana
Bought by
Dsk Rentals Ii Llc
Current Estimated Value
Purchase Details
Closed on
Aug 13, 2015
Sold by
Citimortgage Inc
Bought by
Khadzhayev Svitlana V and Khadzhayev Dmytro Y
Purchase Details
Closed on
Jul 20, 2015
Sold by
Grose Darrin L and Grose Julie A
Bought by
Us Bank Na and Wachovia Bank Na
Purchase Details
Closed on
Jun 27, 2000
Sold by
Grose Darrin L
Bought by
Grose Darrin L and Grose Julie A
Purchase Details
Closed on
May 7, 1999
Sold by
Lasalle National Bank
Bought by
Grose Darrin L
Purchase Details
Closed on
Apr 12, 1999
Sold by
Hathaway Kimberly F and Case #97Cve04-4270
Bought by
Lasalle National Bank
Purchase Details
Closed on
Jun 30, 1993
Bought by
Hathaway John
Purchase Details
Closed on
Jun 16, 1993
Purchase Details
Closed on
Oct 18, 1988
Create a Home Valuation Report for This Property
The Home Valuation Report is an in-depth analysis detailing your home's value as well as a comparison with similar homes in the area
Home Values in the Area
Average Home Value in this Area
Purchase History
| Date | Buyer | Sale Price | Title Company |
|---|---|---|---|
| Dsk Rentals Ii Llc | -- | Stewart Ttl Agcy Of Cols Ltd | |
| Khadzhayev Svitlana V | $37,000 | Intitle Agency Inc | |
| Us Bank Na | $83,420 | None Available | |
| Grose Darrin L | -- | Independent Title | |
| Grose Darrin L | $71,000 | Chicago Title | |
| Lasalle National Bank | $63,000 | -- | |
| Hathaway John | -- | -- | |
| -- | -- | -- | |
| -- | $52,000 | -- |
Source: Public Records
Tax History
| Year | Tax Paid | Tax Assessment Tax Assessment Total Assessment is a certain percentage of the fair market value that is determined by local assessors to be the total taxable value of land and additions on the property. | Land | Improvement |
|---|---|---|---|---|
| 2025 | $2,524 | $54,330 | $14,250 | $40,080 |
| 2024 | $2,524 | $54,330 | $14,250 | $40,080 |
| 2023 | $2,416 | $54,320 | $14,245 | $40,075 |
| 2022 | $1,546 | $24,290 | $3,640 | $20,650 |
| 2021 | $1,571 | $24,290 | $3,640 | $20,650 |
| 2020 | $1,555 | $24,290 | $3,640 | $20,650 |
| 2019 | $1,486 | $20,270 | $3,050 | $17,220 |
| 2018 | $1,486 | $20,270 | $3,050 | $17,220 |
| 2017 | $1,477 | $20,270 | $3,050 | $17,220 |
| 2016 | $1,541 | $20,200 | $4,620 | $15,580 |
| 2015 | $827 | $20,200 | $4,620 | $15,580 |
| 2014 | $1,477 | $20,200 | $4,620 | $15,580 |
| 2013 | $881 | $23,730 | $5,425 | $18,305 |
Source: Public Records
Map
Nearby Homes
- 154 Maple Dr
- 69 Lawrence Ave
- 185 Sturbridge Rd
- 5409 Longworth Dr
- 110 Inah Ave
- 89 Postle Blvd
- 381 Pasadena Ave
- 396 Pasadena Ave
- 443 Lawrence Ave
- 352 Postle Blvd
- 102 Redmond Rd
- 5713 Larksdale Dr
- 354 Fernhill Ave
- 87 Tarryton Ct W Unit 18D
- 97 Tarryton Ct W Unit 19-H
- 376 Galloway Ridge Dr
- 463 Darbyhurst Rd
- 129 Beacon Run W Unit 21C
- 4723 Tarryton Ct S Unit 14-E
- 400 Evergreen Terrace
Your Personal Tour Guide
Ask me questions while you tour the home.