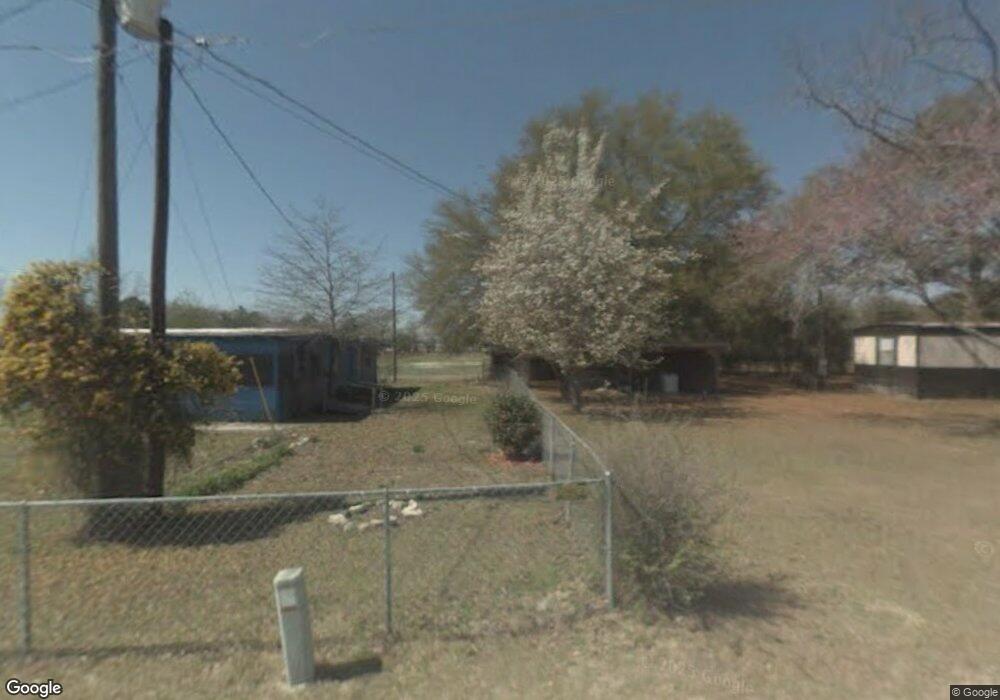
73 Mercer Rd Waycross, GA 31503
Estimated Value: $122,677 - $150,000
3
Beds
1
Bath
963
Sq Ft
$142/Sq Ft
Est. Value
About This Home
This home is located at 73 Mercer Rd, Waycross, GA 31503 and is currently estimated at $136,419, approximately $141 per square foot. 73 Mercer Rd is a home located in Brantley County with nearby schools including Hoboken Elementary School, Brantley County Middle School, and Brantley County High School.
Ownership History
Date
Name
Owned For
Owner Type
Purchase Details
Closed on
Apr 14, 2023
Sold by
Aldridge Lucas Rhen
Bought by
Thigpen Sierra Elizabeth
Current Estimated Value
Home Financials for this Owner
Home Financials are based on the most recent Mortgage that was taken out on this home.
Original Mortgage
$130,808
Outstanding Balance
$127,173
Interest Rate
6.6%
Mortgage Type
New Conventional
Estimated Equity
$9,246
Purchase Details
Closed on
Dec 13, 2019
Sold by
Mathie Brian
Bought by
Aldridge Lucas Rhen
Home Financials for this Owner
Home Financials are based on the most recent Mortgage that was taken out on this home.
Original Mortgage
$71,677
Interest Rate
3.7%
Mortgage Type
FHA
Purchase Details
Closed on
Mar 28, 2019
Sold by
Bishop-Mathie Sandra
Bought by
Mathie Brian
Purchase Details
Closed on
Apr 14, 2006
Sold by
Reevers Donnie
Bought by
Bishop Sandra
Purchase Details
Closed on
Jun 17, 2005
Sold by
Reeves Debra Sue
Bought by
Reeves Donnie
Create a Home Valuation Report for This Property
The Home Valuation Report is an in-depth analysis detailing your home's value as well as a comparison with similar homes in the area
Home Values in the Area
Average Home Value in this Area
Purchase History
| Date | Buyer | Sale Price | Title Company |
|---|---|---|---|
| Thigpen Sierra Elizabeth | $129,500 | -- | |
| Aldridge Lucas Rhen | $73,000 | -- | |
| Mathie Brian | -- | -- | |
| Bishop Sandra | $70,000 | -- | |
| Reeves Donnie | -- | -- |
Source: Public Records
Mortgage History
| Date | Status | Borrower | Loan Amount |
|---|---|---|---|
| Open | Thigpen Sierra Elizabeth | $130,808 | |
| Previous Owner | Aldridge Lucas Rhen | $71,677 |
Source: Public Records
Tax History Compared to Growth
Tax History
| Year | Tax Paid | Tax Assessment Tax Assessment Total Assessment is a certain percentage of the fair market value that is determined by local assessors to be the total taxable value of land and additions on the property. | Land | Improvement |
|---|---|---|---|---|
| 2024 | $1,308 | $32,936 | $2,760 | $30,176 |
| 2023 | $1,265 | $31,358 | $1,182 | $30,176 |
| 2022 | $1,223 | $29,983 | $1,182 | $28,801 |
| 2021 | $881 | $18,785 | $1,182 | $17,603 |
| 2020 | $900 | $18,785 | $1,182 | $17,603 |
| 2019 | $938 | $20,001 | $2,398 | $17,603 |
| 2018 | $756 | $22,341 | $4,738 | $17,603 |
| 2017 | $756 | $22,341 | $4,738 | $17,603 |
| 2016 | $1,042 | $22,341 | $4,738 | $17,603 |
| 2015 | -- | $22,341 | $4,738 | $17,603 |
Source: Public Records
Map
Nearby Homes
- 56 Fj Melton Ln
- 563 Bennett Rd
- 7532 Central Ave
- 157 Hwy
- 115 Travis Trail
- 0 Miles Still Rd
- 7312 Blue Lake Cir
- 5588 Brunswick Hwy
- 120 Scarlett Dr
- 300 Josephine Park Rd
- 6932 Greenfield Rd
- 6934 Greenfield Rd
- 6930 Greenfield Rd
- 6935 Greenfield Rd
- 6929 Greenfield Rd
- 6927 Greenfield Rd
- 6498 Central Ave
- 4003 Harvard Ave
- 12091 Central Ave
- 12169 Central Ave
- 126 Mercer Rd
- 39 Mercer Rd
- 0 Mercer Rd
- 160 Mercer Rd
- 44 Mercer Rd
- 180 Mercer Rd
- 112 Mercer Rd
- 8979 Central Ave
- 8928 Central Ave
- 5 Douglas Ln
- 83 Douglas Ln
- 8929 Central Ave
- 175 Douglas Ln
- 88 Fj Melton Ln
- 89 Fj Melton Ln
- 8867 Central Ave
- 9173 Central Ave
- 8878 Central Ave
- 124 Fj Melton Ln
- 48 Gus Aldridge Ln