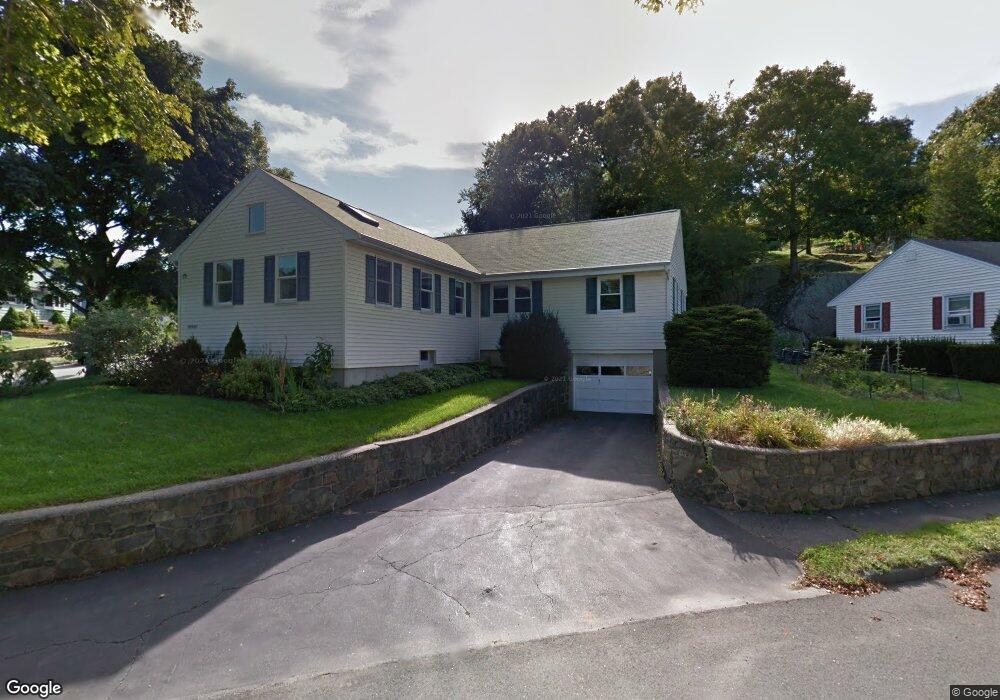
73 Moffatt Rd Salem, MA 01970
South Salem NeighborhoodEstimated Value: $697,000 - $747,000
3
Beds
2
Baths
1,274
Sq Ft
$566/Sq Ft
Est. Value
About This Home
This home is located at 73 Moffatt Rd, Salem, MA 01970 and is currently estimated at $720,544, approximately $565 per square foot. 73 Moffatt Rd is a home located in Essex County with nearby schools including Saltonstall School, Horace Mann Laboratory, and Witchcraft Heights Elementary School.
Ownership History
Date
Name
Owned For
Owner Type
Purchase Details
Closed on
Oct 11, 2011
Sold by
Morgan Nancy M and Mahoney John T
Bought by
Morgan Nancy M and Mahoney John T
Current Estimated Value
Home Financials for this Owner
Home Financials are based on the most recent Mortgage that was taken out on this home.
Original Mortgage
$110,000
Interest Rate
4.33%
Purchase Details
Closed on
Jul 17, 2001
Sold by
Mcleod Mathilde F Est
Bought by
Morgan Nancy M and Mahoney John T
Home Financials for this Owner
Home Financials are based on the most recent Mortgage that was taken out on this home.
Original Mortgage
$153,000
Interest Rate
7.2%
Mortgage Type
Purchase Money Mortgage
Create a Home Valuation Report for This Property
The Home Valuation Report is an in-depth analysis detailing your home's value as well as a comparison with similar homes in the area
Home Values in the Area
Average Home Value in this Area
Purchase History
| Date | Buyer | Sale Price | Title Company |
|---|---|---|---|
| Morgan Nancy M | -- | -- | |
| Morgan Nancy M | $1,176 | -- |
Source: Public Records
Mortgage History
| Date | Status | Borrower | Loan Amount |
|---|---|---|---|
| Closed | Morgan Nancy M | $110,000 | |
| Previous Owner | Morgan Nancy M | $100,000 | |
| Previous Owner | Morgan Nancy M | $148,500 | |
| Previous Owner | Morgan Nancy M | $153,000 |
Source: Public Records
Tax History
| Year | Tax Paid | Tax Assessment Tax Assessment Total Assessment is a certain percentage of the fair market value that is determined by local assessors to be the total taxable value of land and additions on the property. | Land | Improvement |
|---|---|---|---|---|
| 2025 | $7,368 | $649,700 | $242,300 | $407,400 |
| 2024 | $7,389 | $635,900 | $228,600 | $407,300 |
| 2023 | $6,999 | $559,500 | $208,200 | $351,300 |
| 2022 | $6,299 | $475,400 | $191,100 | $284,300 |
| 2021 | $6,086 | $441,000 | $177,500 | $263,500 |
| 2020 | $5,955 | $412,100 | $174,000 | $238,100 |
| 2019 | $5,814 | $385,000 | $163,800 | $221,200 |
| 2018 | $5,202 | $338,200 | $152,900 | $185,300 |
| 2017 | $5,143 | $324,300 | $143,300 | $181,000 |
| 2016 | $5,082 | $324,300 | $143,300 | $181,000 |
| 2015 | $4,739 | $288,800 | $126,300 | $162,500 |
Source: Public Records
Map
Nearby Homes
- 28 Surrey Rd
- 8 Russell Dr Unit 7D
- 3 Stillwell Dr Unit 10B
- 106 Broadway Unit 3
- 79 Lawrence St
- 6 Arthur St Unit 3
- 469 Loring Ave
- 259 Jefferson Ave
- 29 Willson St
- 4 Fairview Rd
- 24 Wisteria St Unit 2
- 326 Lafayette St Unit 2
- 37 Weatherly Dr
- 49 Weatherly Dr
- 30 Weatherly Dr
- 11 Weatherly Dr
- 11 Angenica Terrace
- 1008 Paradise Rd Unit 1M
- 1002 Paradise Rd Unit PHE
- 13 Bengal Ln
Your Personal Tour Guide
Ask me questions while you tour the home.