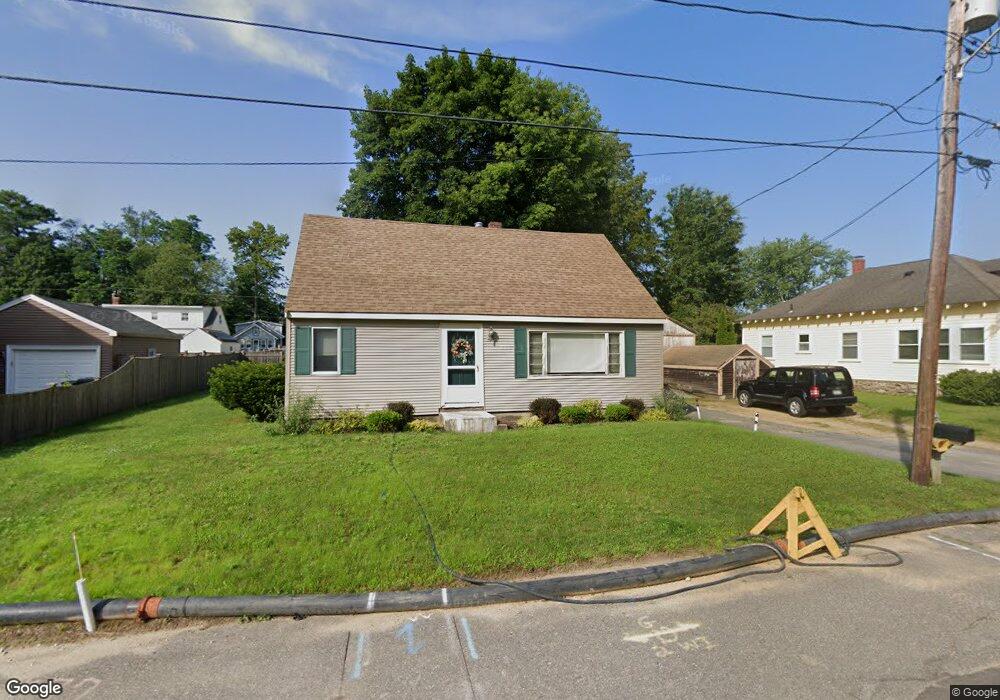
73 Montclair Rd Haverhill, MA 01830
Upper Main Street NeighborhoodEstimated Value: $549,000 - $609,000
3
Beds
3
Baths
1,421
Sq Ft
$405/Sq Ft
Est. Value
About This Home
This home is located at 73 Montclair Rd, Haverhill, MA 01830 and is currently estimated at $575,675, approximately $405 per square foot. 73 Montclair Rd is a home located in Essex County with nearby schools including Pentucket Lake Elementary School, Sacred Heart School, and Bradford Christian Academy.
Ownership History
Date
Name
Owned For
Owner Type
Purchase Details
Closed on
Feb 28, 1992
Sold by
Malbon John D and Malbon Judith
Bought by
Albanese Gary G and Albanese Laurie
Current Estimated Value
Home Financials for this Owner
Home Financials are based on the most recent Mortgage that was taken out on this home.
Original Mortgage
$96,000
Interest Rate
8.38%
Mortgage Type
Purchase Money Mortgage
Create a Home Valuation Report for This Property
The Home Valuation Report is an in-depth analysis detailing your home's value as well as a comparison with similar homes in the area
Home Values in the Area
Average Home Value in this Area
Purchase History
| Date | Buyer | Sale Price | Title Company |
|---|---|---|---|
| Albanese Gary G | $120,100 | -- |
Source: Public Records
Mortgage History
| Date | Status | Borrower | Loan Amount |
|---|---|---|---|
| Closed | Albanese Gary G | $96,000 |
Source: Public Records
Tax History Compared to Growth
Tax History
| Year | Tax Paid | Tax Assessment Tax Assessment Total Assessment is a certain percentage of the fair market value that is determined by local assessors to be the total taxable value of land and additions on the property. | Land | Improvement |
|---|---|---|---|---|
| 2025 | $4,589 | $428,500 | $181,300 | $247,200 |
| 2024 | $4,296 | $403,800 | $165,400 | $238,400 |
| 2023 | $4,211 | $377,700 | $165,400 | $212,300 |
| 2022 | $4,056 | $318,900 | $151,100 | $167,800 |
| 2021 | $3,982 | $296,300 | $141,600 | $154,700 |
| 2020 | $3,943 | $289,900 | $135,200 | $154,700 |
| 2019 | $3,800 | $272,400 | $117,700 | $154,700 |
| 2018 | $3,663 | $256,900 | $111,300 | $145,600 |
| 2017 | $3,647 | $243,300 | $108,200 | $135,100 |
| 2016 | $3,550 | $231,100 | $98,600 | $132,500 |
| 2015 | $3,547 | $231,100 | $98,600 | $132,500 |
Source: Public Records
Map
Nearby Homes
- 994 Main St
- 1022 Main St
- 55 Ledge Rd
- 19 King St
- 51 Rosemont St
- 0 Plaistow Rd Unit 73184617
- 113 Brickett Hill Cir Unit 113
- 175 Brickett Hill Cir Unit 175
- 119 Brickett Hill Cir Unit 119
- 120 Brickett Hill Cir Unit 120
- 440 North Ave Unit 60
- 440 North Ave Unit 145
- 440 North Ave Unit 234
- 440 North Ave Unit 110
- 8 Iris Way Unit 8
- 42 Plaistow Rd
- 140 North Ave
- 171 North Ave
- 21 Eudora St
- 23 Winona Ave