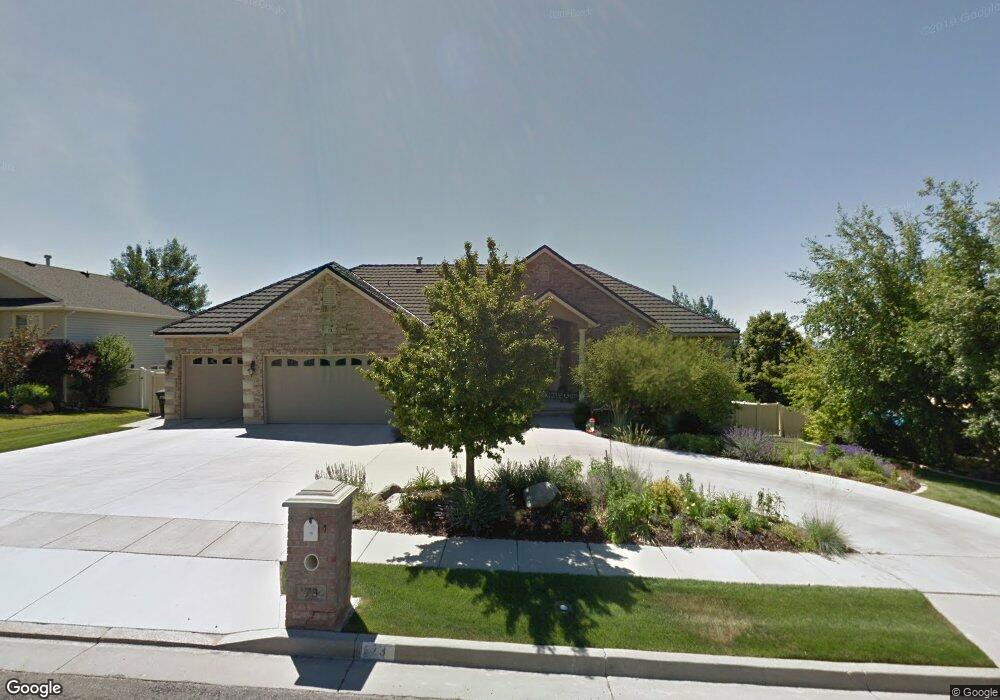
73 N Highland Blvd Brigham City, UT 84302
Estimated Value: $619,000 - $750,000
--
Bed
--
Bath
2,390
Sq Ft
$287/Sq Ft
Est. Value
About This Home
This home is located at 73 N Highland Blvd, Brigham City, UT 84302 and is currently estimated at $685,001, approximately $286 per square foot. 73 N Highland Blvd is a home located in Box Elder County with nearby schools including Box Elder Middle School, Adele C. Young Intermediate School, and Box Elder High School.
Ownership History
Date
Name
Owned For
Owner Type
Purchase Details
Closed on
Aug 14, 2024
Sold by
Teresa Michelle Moore Inter Vivos Trust and Moore Teresa Michelle
Bought by
James Oakley Moore Inter Vivos Trust and Moore
Current Estimated Value
Create a Home Valuation Report for This Property
The Home Valuation Report is an in-depth analysis detailing your home's value as well as a comparison with similar homes in the area
Home Values in the Area
Average Home Value in this Area
Purchase History
| Date | Buyer | Sale Price | Title Company |
|---|---|---|---|
| James Oakley Moore Inter Vivos Trust | -- | Phillips Hansen Land Title |
Source: Public Records
Tax History Compared to Growth
Tax History
| Year | Tax Paid | Tax Assessment Tax Assessment Total Assessment is a certain percentage of the fair market value that is determined by local assessors to be the total taxable value of land and additions on the property. | Land | Improvement |
|---|---|---|---|---|
| 2025 | $3,703 | $700,138 | $105,000 | $595,138 |
| 2024 | $3,703 | $712,890 | $100,000 | $612,890 |
| 2023 | $4,061 | $800,442 | $95,000 | $705,442 |
| 2022 | $3,916 | $394,656 | $22,000 | $372,656 |
| 2021 | $3,231 | $506,565 | $40,000 | $466,565 |
| 2020 | $3,118 | $506,565 | $40,000 | $466,565 |
| 2019 | $2,881 | $249,089 | $22,000 | $227,089 |
| 2018 | $2,553 | $219,469 | $22,000 | $197,469 |
| 2017 | $2,394 | $356,232 | $16,500 | $326,232 |
| 2016 | $2,490 | $187,383 | $16,500 | $170,883 |
| 2015 | $2,269 | $171,849 | $16,500 | $155,349 |
| 2014 | $2,269 | $164,451 | $16,500 | $147,951 |
| 2013 | -- | $164,451 | $16,500 | $147,951 |
Source: Public Records
Map
Nearby Homes
- 81 N Highland Blvd
- 61 N Highland Blvd
- 82 N Eliason Ave
- 88 N Eliason Ave
- 91 N Highland Blvd
- 78 N Highland Blvd
- 53 N Highland Blvd
- 1152 E Eliason Ave
- 72 N Highland Blvd Unit 12
- 72 N Highland Blvd Unit 12
- 72 N Highland Blvd
- 62 N Highland Blvd
- 86 N Highland Blvd
- 98 N Eliason Ave
- 101 N Highland Blvd
- 54 N Highland Blvd
- 1148 E Eliason Ave
- 41 N Highland Blvd
- 96 N Highland Blvd
- 93 N Eliason Ave