Estimated Value: $241,000 - $268,000
2
Beds
1
Bath
1,248
Sq Ft
$202/Sq Ft
Est. Value
About This Home
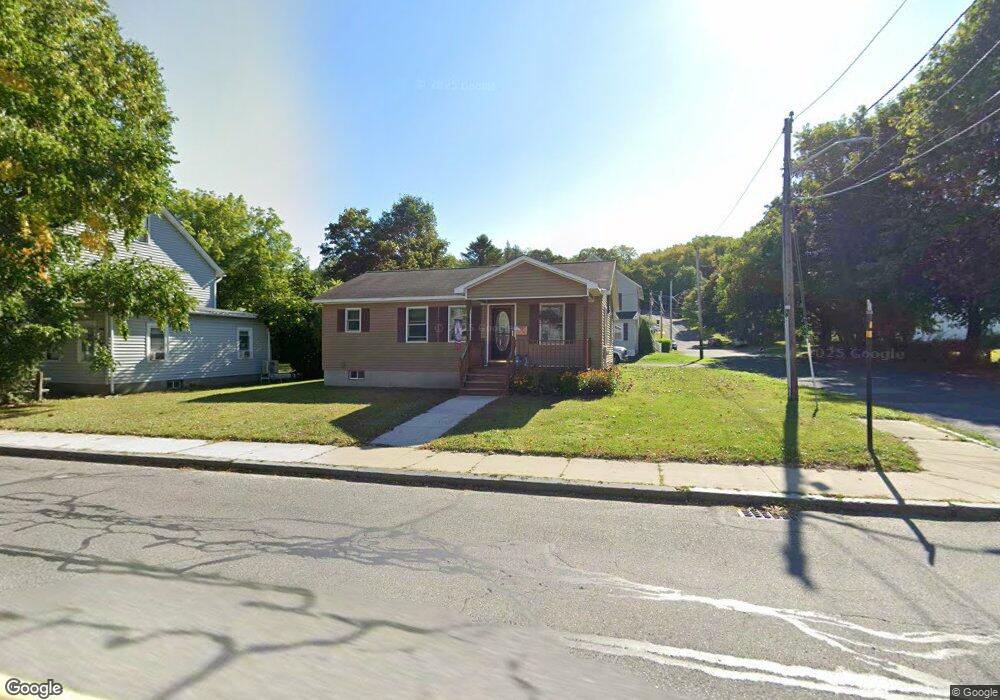
This home is located at 73 N Summer St, Adams, MA 01220 and is currently estimated at $252,262, approximately $202 per square foot. 73 N Summer St is a home located in Berkshire County with nearby schools including Hoosac Valley Middle & High School, Berkshire Arts & Technology Charter Public School, and St. Stanislaus Kostka School.
Ownership History
Date
Name
Owned For
Owner Type
Purchase Details
Closed on
Jan 3, 2012
Sold by
Lawson Brian K
Bought by
Lawson Brian K
Current Estimated Value
Purchase Details
Closed on
Mar 3, 2005
Sold by
Kruzel Francis S and Kruzel Nancy A
Bought by
Lawson Brian K
Home Financials for this Owner
Home Financials are based on the most recent Mortgage that was taken out on this home.
Original Mortgage
$150,000
Interest Rate
5.66%
Mortgage Type
Purchase Money Mortgage
Purchase Details
Closed on
Jul 14, 1995
Sold by
Rysz Frances M and Iacuessa Alice M
Bought by
Kruzel Francis S
Create a Home Valuation Report for This Property
The Home Valuation Report is an in-depth analysis detailing your home's value as well as a comparison with similar homes in the area
Home Values in the Area
Average Home Value in this Area
Purchase History
| Date | Buyer | Sale Price | Title Company |
|---|---|---|---|
| Lawson Brian K | -- | -- | |
| Lawson Brian K | $25,000 | -- | |
| Kruzel Francis S | $20,000 | -- |
Source: Public Records
Mortgage History
| Date | Status | Borrower | Loan Amount |
|---|---|---|---|
| Previous Owner | Lawson Brian K | $150,000 |
Source: Public Records
Tax History Compared to Growth
Tax History
| Year | Tax Paid | Tax Assessment Tax Assessment Total Assessment is a certain percentage of the fair market value that is determined by local assessors to be the total taxable value of land and additions on the property. | Land | Improvement |
|---|---|---|---|---|
| 2025 | $4,088 | $240,300 | $39,500 | $200,800 |
| 2024 | $3,841 | $219,000 | $37,100 | $181,900 |
| 2023 | $3,567 | $192,300 | $34,100 | $158,200 |
| 2022 | $3,468 | $166,000 | $29,600 | $136,400 |
| 2021 | $3,359 | $148,500 | $29,600 | $118,900 |
| 2020 | $3,188 | $145,700 | $29,600 | $116,100 |
| 2019 | $3,117 | $145,700 | $29,600 | $116,100 |
| 2018 | $3,249 | $146,300 | $29,600 | $116,700 |
| 2017 | $3,126 | $146,300 | $29,600 | $116,700 |
| 2016 | $2,986 | $139,600 | $29,600 | $110,000 |
| 2015 | $2,955 | $138,300 | $31,200 | $107,100 |
| 2014 | $2,759 | $138,300 | $31,200 | $107,100 |
Source: Public Records
Map
Nearby Homes