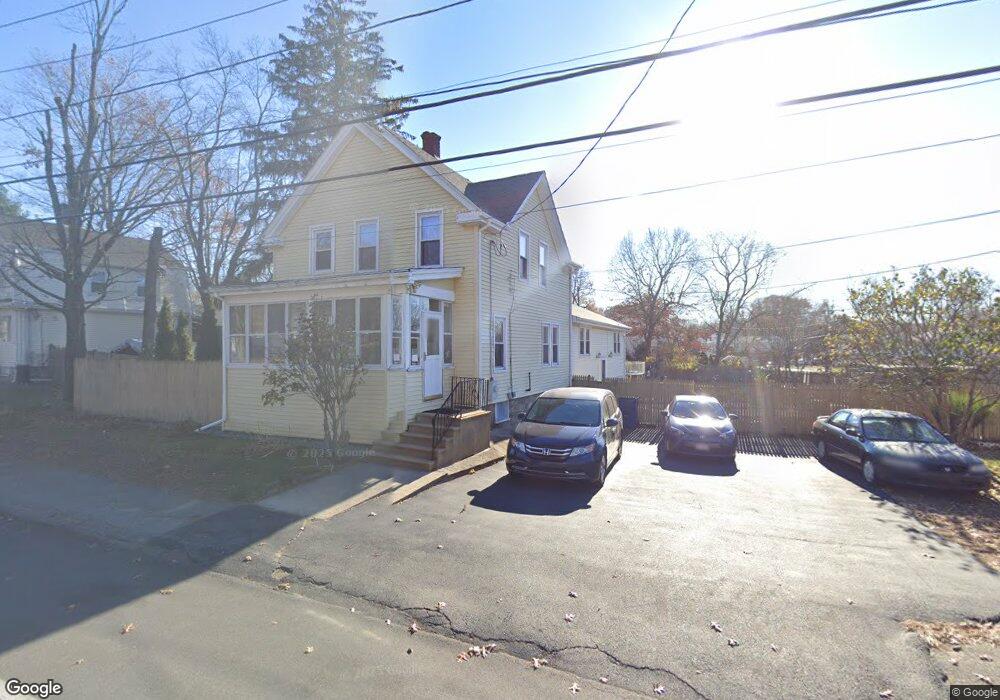
73 Oak St Randolph, MA 02368
North Randolph NeighborhoodEstimated Value: $645,138 - $840,000
4
Beds
3
Baths
2,279
Sq Ft
$317/Sq Ft
Est. Value
About This Home
This home is located at 73 Oak St, Randolph, MA 02368 and is currently estimated at $721,535, approximately $316 per square foot. 73 Oak St is a home located in Norfolk County with nearby schools including Randolph High School and Lighthouse Baptist Christian Academy.
Ownership History
Date
Name
Owned For
Owner Type
Purchase Details
Closed on
Apr 8, 2014
Sold by
Lee Tricia
Bought by
Truong David and Kwan Xiu
Current Estimated Value
Purchase Details
Closed on
Feb 23, 2005
Sold by
Trinh Anthony and Lee Tricia
Bought by
Lee Tricia
Home Financials for this Owner
Home Financials are based on the most recent Mortgage that was taken out on this home.
Original Mortgage
$153,000
Interest Rate
5.73%
Mortgage Type
Purchase Money Mortgage
Purchase Details
Closed on
Mar 9, 2001
Sold by
Armstrong Cynthia and Armstrong James A
Bought by
Trinh Anthony and Lee Tricia
Home Financials for this Owner
Home Financials are based on the most recent Mortgage that was taken out on this home.
Original Mortgage
$180,000
Interest Rate
7.15%
Mortgage Type
Purchase Money Mortgage
Create a Home Valuation Report for This Property
The Home Valuation Report is an in-depth analysis detailing your home's value as well as a comparison with similar homes in the area
Home Values in the Area
Average Home Value in this Area
Purchase History
| Date | Buyer | Sale Price | Title Company |
|---|---|---|---|
| Truong David | -- | -- | |
| Lee Tricia | -- | -- | |
| Trinh Anthony | $252,500 | -- |
Source: Public Records
Mortgage History
| Date | Status | Borrower | Loan Amount |
|---|---|---|---|
| Previous Owner | Trinh Anthony | $123,000 | |
| Previous Owner | Lee Tricia | $153,000 | |
| Previous Owner | Trinh Anthony | $180,000 | |
| Previous Owner | Trinh Anthony | $150,750 | |
| Previous Owner | Trinh Anthony | $33,100 |
Source: Public Records
Tax History Compared to Growth
Tax History
| Year | Tax Paid | Tax Assessment Tax Assessment Total Assessment is a certain percentage of the fair market value that is determined by local assessors to be the total taxable value of land and additions on the property. | Land | Improvement |
|---|---|---|---|---|
| 2025 | $6,915 | $595,600 | $234,200 | $361,400 |
| 2024 | $6,805 | $594,300 | $229,800 | $364,500 |
| 2023 | $6,303 | $521,800 | $208,900 | $312,900 |
| 2022 | $6,177 | $454,200 | $174,200 | $280,000 |
| 2021 | $5,946 | $402,300 | $145,100 | $257,200 |
| 2020 | $6,009 | $403,000 | $145,100 | $257,900 |
| 2019 | $5,755 | $384,200 | $138,200 | $246,000 |
| 2018 | $5,558 | $350,000 | $125,600 | $224,400 |
| 2017 | $5,548 | $342,900 | $119,700 | $223,200 |
| 2016 | $5,344 | $307,300 | $108,800 | $198,500 |
| 2015 | $5,084 | $280,900 | $103,600 | $177,300 |
Source: Public Records
Map
Nearby Homes
- 26 Knights Crescent St
- 1 Clark Cir
- 34 Orchard St
- 7 Webster St
- 12 Webster St
- 591 N Main St
- 16 Simmonds Blvd Unit 16
- 20 Simmonds Blvd Unit 20
- 14 Simmonds Blvd Unit 14
- 12 Simmonds Blvd Unit 12
- 44 Liberty St
- 11 Royal Crest Dr Unit 5
- 9 Royal Crest Dr Unit 12
- 33 Liberty St
- 2 Smith Rd
- 12 Jasper Ln Unit 12
- 229 Chestnut St
- 18 Jasper Ln
- 54 Jasper Ln
- 73 Belcher St