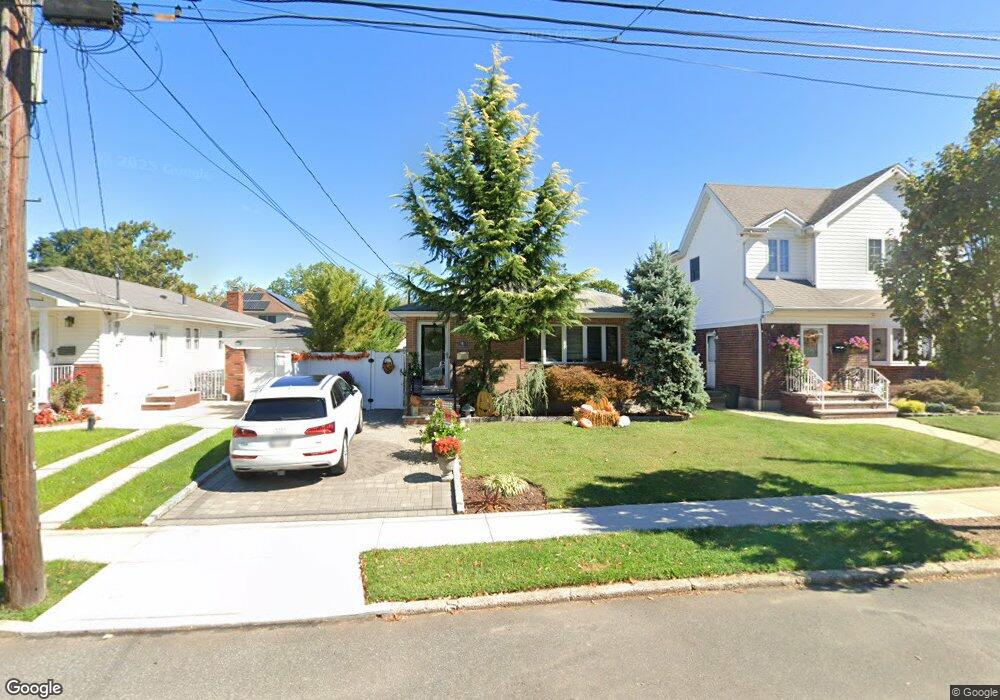
73 Peter Ave Staten Island, NY 10306
Oakwood NeighborhoodEstimated Value: $681,000 - $840,000
--
Bed
4
Baths
1,106
Sq Ft
$675/Sq Ft
Est. Value
About This Home
This home is located at 73 Peter Ave, Staten Island, NY 10306 and is currently estimated at $746,055, approximately $674 per square foot. 73 Peter Ave is a home located in Richmond County with nearby schools including P.S. 50 Frank Hankinson School, Myra S. Barnes Intermediate School 24, and New Dorp High School.
Ownership History
Date
Name
Owned For
Owner Type
Purchase Details
Closed on
Jan 8, 2007
Sold by
Bloom Sheldon and Bloom Gertrude
Bought by
Viscosi Joseph and Viscosi Gayle Marie
Current Estimated Value
Home Financials for this Owner
Home Financials are based on the most recent Mortgage that was taken out on this home.
Original Mortgage
$318,500
Outstanding Balance
$189,592
Interest Rate
6.14%
Mortgage Type
Purchase Money Mortgage
Estimated Equity
$556,463
Purchase Details
Closed on
Jan 17, 1996
Sold by
Bloom Sheldon and Bloom Gertrude
Bought by
Bloom Sheldon and Bloom Gertrude
Create a Home Valuation Report for This Property
The Home Valuation Report is an in-depth analysis detailing your home's value as well as a comparison with similar homes in the area
Home Values in the Area
Average Home Value in this Area
Purchase History
| Date | Buyer | Sale Price | Title Company |
|---|---|---|---|
| Viscosi Joseph | $418,500 | First Amer Title Ins Co Ny | |
| Bloom Sheldon | -- | Chicago Title Insurance Co |
Source: Public Records
Mortgage History
| Date | Status | Borrower | Loan Amount |
|---|---|---|---|
| Open | Viscosi Joseph | $318,500 |
Source: Public Records
Tax History Compared to Growth
Tax History
| Year | Tax Paid | Tax Assessment Tax Assessment Total Assessment is a certain percentage of the fair market value that is determined by local assessors to be the total taxable value of land and additions on the property. | Land | Improvement |
|---|---|---|---|---|
| 2025 | $7,427 | $41,700 | $11,896 | $29,804 |
| 2024 | $7,427 | $38,820 | $12,631 | $26,189 |
| 2023 | $7,510 | $36,979 | $11,398 | $25,581 |
| 2022 | $6,993 | $36,900 | $13,260 | $23,640 |
| 2021 | $6,955 | $37,440 | $13,260 | $24,180 |
| 2020 | $6,599 | $39,660 | $13,260 | $26,400 |
| 2019 | $6,446 | $38,700 | $13,260 | $25,440 |
| 2018 | $6,282 | $30,816 | $13,198 | $17,618 |
| 2017 | $5,950 | $29,190 | $12,699 | $16,491 |
| 2016 | $5,505 | $27,538 | $11,794 | $15,744 |
| 2015 | $4,928 | $25,980 | $11,040 | $14,940 |
| 2014 | $4,928 | $25,680 | $11,040 | $14,640 |
Source: Public Records
Map
Nearby Homes
- 351 8th St
- 77 Penn Ave
- 4 Penn Ave
- 13 Ella Place
- 23 Acorn St
- 305 Tysens Ln Unit B
- 20 Francine Ct Unit A
- 32 Francine Ct Unit B
- 122 Guyon Ave
- 745 Clawson St
- 205 Penn Ave
- 52A Francine Ct Unit 80A
- 77 Acorn St
- 52 Francine Ct Unit A
- 193 10th St
- 52 Farrell Ct
- 193 10 St
- 91 Allison Ave
- 2889 Amboy Rd
- 231 Adelaide Ave