Estimated Value: $210,000 - $260,000
3
Beds
2
Baths
1,339
Sq Ft
$180/Sq Ft
Est. Value
About This Home
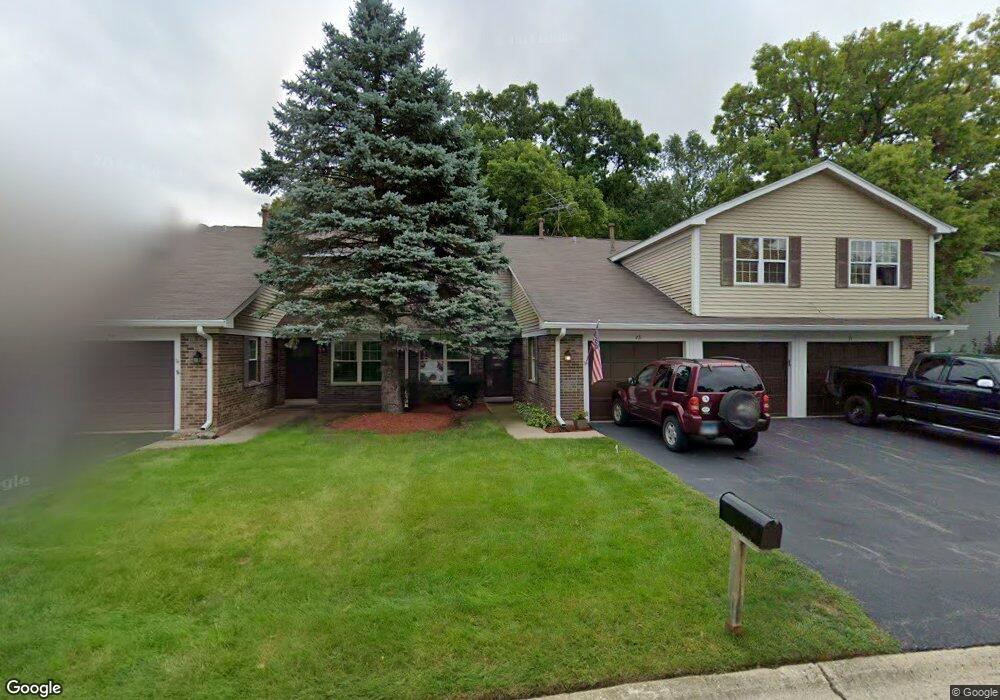
This home is located at 73 Pine Cir Unit 3, Cary, IL 60013 and is currently estimated at $241,216, approximately $180 per square foot. 73 Pine Cir Unit 3 is a home located in McHenry County with nearby schools including Deer Path Elementary School, Cary Jr High School, and Cary Grove High School.
Ownership History
Date
Name
Owned For
Owner Type
Purchase Details
Closed on
Sep 4, 2018
Sold by
Polcik Ryan
Bought by
Polcik Ryan and Wessley Ann Marie
Current Estimated Value
Purchase Details
Closed on
Jan 20, 2016
Sold by
Everbank
Bought by
Secretary Of H U D
Purchase Details
Closed on
Dec 17, 2015
Sold by
Landvick Mark and Landvick Mark A
Bought by
Everbank
Purchase Details
Closed on
Jul 29, 2003
Sold by
Hendrick Alica
Bought by
Landvick Mark A and Landvick Sandy L
Home Financials for this Owner
Home Financials are based on the most recent Mortgage that was taken out on this home.
Original Mortgage
$136,852
Interest Rate
6.04%
Mortgage Type
FHA
Purchase Details
Closed on
Jun 4, 1999
Sold by
Bailey Ruth E and Mareci Ruth E
Bought by
Hendrick Alicia
Home Financials for this Owner
Home Financials are based on the most recent Mortgage that was taken out on this home.
Original Mortgage
$94,223
Interest Rate
7.28%
Mortgage Type
FHA
Create a Home Valuation Report for This Property
The Home Valuation Report is an in-depth analysis detailing your home's value as well as a comparison with similar homes in the area
Home Values in the Area
Average Home Value in this Area
Purchase History
| Date | Buyer | Sale Price | Title Company |
|---|---|---|---|
| Polcik Ryan | -- | Attorney | |
| Secretary Of H U D | -- | Servicelink | |
| Everbank | -- | Premier Title | |
| Landvick Mark A | $139,000 | Universal Title Services Inc | |
| Hendrick Alicia | $95,000 | -- |
Source: Public Records
Mortgage History
| Date | Status | Borrower | Loan Amount |
|---|---|---|---|
| Previous Owner | Landvick Mark A | $136,852 | |
| Previous Owner | Hendrick Alicia | $94,223 |
Source: Public Records
Tax History Compared to Growth
Tax History
| Year | Tax Paid | Tax Assessment Tax Assessment Total Assessment is a certain percentage of the fair market value that is determined by local assessors to be the total taxable value of land and additions on the property. | Land | Improvement |
|---|---|---|---|---|
| 2024 | $4,523 | $61,703 | $12,923 | $48,780 |
| 2023 | $4,368 | $55,186 | $11,558 | $43,628 |
| 2022 | $3,870 | $47,326 | $10,431 | $36,895 |
| 2021 | $3,665 | $44,090 | $9,718 | $34,372 |
| 2020 | $3,544 | $42,529 | $9,374 | $33,155 |
| 2019 | $3,459 | $40,705 | $8,972 | $31,733 |
| 2018 | $3,109 | $36,385 | $8,288 | $28,097 |
| 2017 | $3,026 | $34,277 | $7,808 | $26,469 |
| 2016 | $3,660 | $32,149 | $7,323 | $24,826 |
| 2013 | $1,605 | $34,233 | $6,831 | $27,402 |
Source: Public Records
Map
Nearby Homes
- 20 Willow Cir
- 1213 W Lake Dr
- 60 Forest Ln
- 1200 W Lake Dr
- 60 Bright Oaks Cir Unit 1
- 1173 Amber Dr
- 16 Forest Ln
- 120 Bright Oaks Cir
- 1129 Amber Dr
- 20 Oak Valley Dr Unit 2
- 1415 Carmel Ln
- 2819 Sun Valley Dr
- 2610 Killarney Dr
- 0 Kaper Dr
- 888 Blazing Star Trail
- 6312 Londonderry Dr
- 763 Blazing Star Trail
- 340 W Margaret Terrace
- 336 W Margaret Terrace
- 710 Cimarron Dr