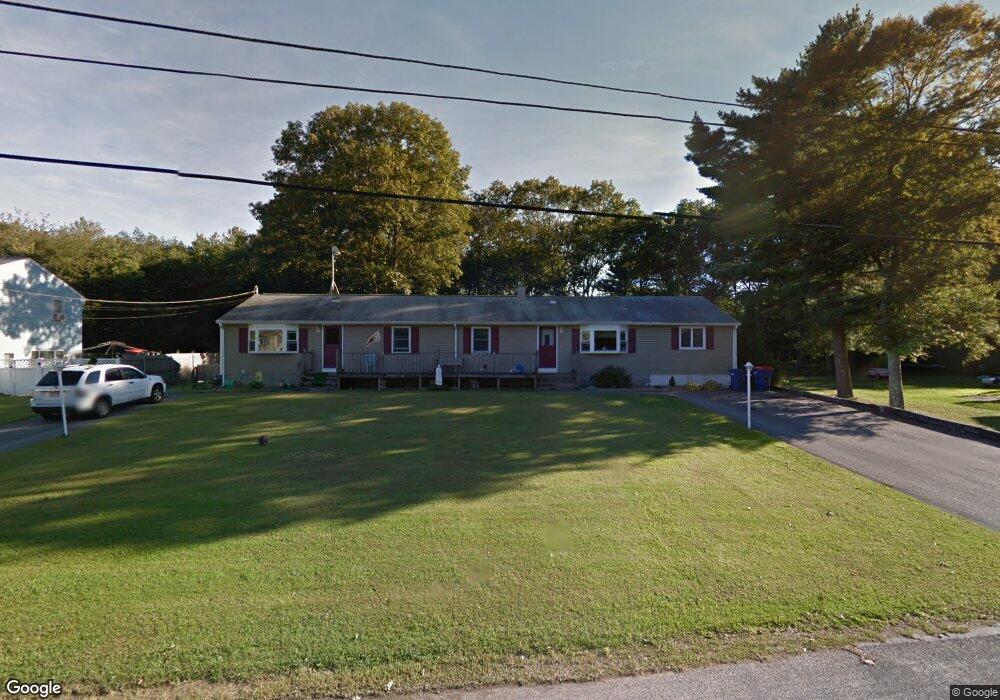
73 R Dr Unit 75 Westport, MA 02790
North Westport NeighborhoodEstimated Value: $442,000 - $627,000
5
Beds
--
Bath
1,920
Sq Ft
$261/Sq Ft
Est. Value
About This Home
This home is located at 73 R Dr Unit 75, Westport, MA 02790 and is currently estimated at $500,507, approximately $260 per square foot. 73 R Dr Unit 75 is a home located in Bristol County with nearby schools including Alice A. Macomber Primary School, Westport Elementary School, and Westport Middle-High School.
Ownership History
Date
Name
Owned For
Owner Type
Purchase Details
Closed on
Sep 19, 2023
Sold by
Pacheco James C and Pacheco Diane Y
Bought by
Pacheco Ft and Pacheco
Current Estimated Value
Create a Home Valuation Report for This Property
The Home Valuation Report is an in-depth analysis detailing your home's value as well as a comparison with similar homes in the area
Home Values in the Area
Average Home Value in this Area
Purchase History
| Date | Buyer | Sale Price | Title Company |
|---|---|---|---|
| Pacheco Ft | -- | None Available |
Source: Public Records
Tax History Compared to Growth
Tax History
| Year | Tax Paid | Tax Assessment Tax Assessment Total Assessment is a certain percentage of the fair market value that is determined by local assessors to be the total taxable value of land and additions on the property. | Land | Improvement |
|---|---|---|---|---|
| 2025 | $2,977 | $399,600 | $161,900 | $237,700 |
| 2024 | $2,753 | $356,200 | $150,000 | $206,200 |
| 2023 | $2,701 | $331,000 | $136,600 | $194,400 |
| 2022 | $2,443 | $294,700 | $124,200 | $170,500 |
| 2021 | $2,443 | $283,400 | $112,900 | $170,500 |
| 2020 | $2,351 | $278,900 | $108,400 | $170,500 |
| 2019 | $2,280 | $275,700 | $108,400 | $167,300 |
| 2018 | $2,091 | $255,900 | $109,600 | $146,300 |
| 2017 | $1,990 | $249,700 | $106,100 | $143,600 |
| 2016 | $1,889 | $238,800 | $102,600 | $136,200 |
| 2015 | $1,692 | $213,400 | $104,900 | $108,500 |
Source: Public Records
Map
Nearby Homes