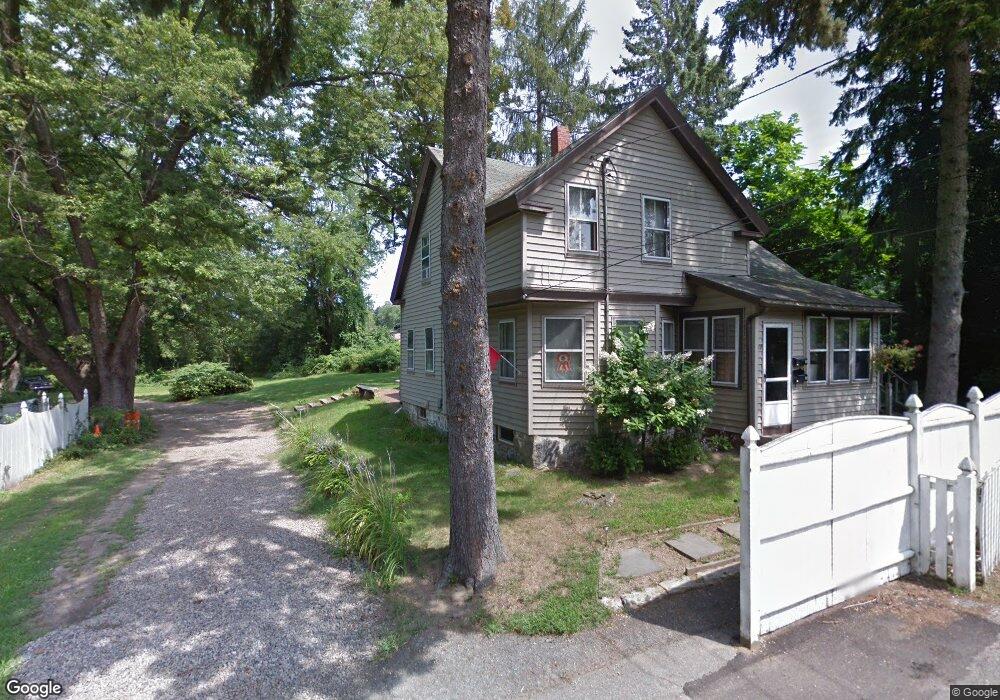
73 Riverview St Unit 1 North Andover, MA 01845
Estimated Value: $725,700 - $907,000
2
Beds
1
Bath
1,100
Sq Ft
$731/Sq Ft
Est. Value
About This Home
This home is located at 73 Riverview St Unit 1, North Andover, MA 01845 and is currently estimated at $803,675, approximately $730 per square foot. 73 Riverview St Unit 1 is a home located in Essex County with nearby schools including Thomson Elementary School, North Andover Middle School, and North Andover High School.
Ownership History
Date
Name
Owned For
Owner Type
Purchase Details
Closed on
Dec 4, 2009
Sold by
Tortorelli John V
Bought by
Tortorelli John V and Tortorelli Ofelin A
Current Estimated Value
Home Financials for this Owner
Home Financials are based on the most recent Mortgage that was taken out on this home.
Original Mortgage
$153,923
Outstanding Balance
$100,963
Interest Rate
5.01%
Mortgage Type
Purchase Money Mortgage
Estimated Equity
$702,712
Purchase Details
Closed on
Jul 17, 2009
Sold by
Coletti Scott R and Hsbc Bank Usa
Bought by
Hsbc Bank Usa
Purchase Details
Closed on
Dec 17, 2002
Sold by
Sands Benjamin F and Sands Douglas
Bought by
Coletti Scott R and Coletti Rhonda E
Home Financials for this Owner
Home Financials are based on the most recent Mortgage that was taken out on this home.
Original Mortgage
$234,000
Interest Rate
6.17%
Mortgage Type
Purchase Money Mortgage
Create a Home Valuation Report for This Property
The Home Valuation Report is an in-depth analysis detailing your home's value as well as a comparison with similar homes in the area
Home Values in the Area
Average Home Value in this Area
Purchase History
| Date | Buyer | Sale Price | Title Company |
|---|---|---|---|
| Tortorelli John V | -- | -- | |
| Tortorelli John V | $199,900 | -- | |
| Hsbc Bank Usa | $216,690 | -- | |
| Coletti Scott R | $260,000 | -- |
Source: Public Records
Mortgage History
| Date | Status | Borrower | Loan Amount |
|---|---|---|---|
| Open | Tortorelli John V | $153,923 | |
| Closed | Tortorelli John V | $39,980 | |
| Previous Owner | Coletti Scott R | $234,000 |
Source: Public Records
Tax History Compared to Growth
Tax History
| Year | Tax Paid | Tax Assessment Tax Assessment Total Assessment is a certain percentage of the fair market value that is determined by local assessors to be the total taxable value of land and additions on the property. | Land | Improvement |
|---|---|---|---|---|
| 2025 | $7,138 | $633,900 | $300,800 | $333,100 |
| 2024 | $6,765 | $610,000 | $298,700 | $311,300 |
| 2023 | $6,491 | $530,300 | $293,200 | $237,100 |
| 2022 | $7,107 | $525,300 | $267,100 | $258,200 |
| 2021 | $6,834 | $482,300 | $240,900 | $241,400 |
| 2020 | $6,246 | $454,600 | $230,000 | $224,600 |
| 2019 | $5,666 | $422,500 | $230,000 | $192,500 |
| 2018 | $6,139 | $422,500 | $230,000 | $192,500 |
| 2017 | $5,128 | $359,100 | $178,600 | $180,500 |
| 2016 | $4,960 | $347,600 | $178,600 | $169,000 |
| 2015 | $4,481 | $311,400 | $186,300 | $125,100 |
Source: Public Records
Map
Nearby Homes
- 62 Brightwood Ave
- 385 Sutton St
- 29 Brightwood Ave
- 148 Main St Unit A508
- 148 Main St Unit C538
- 148 Main St Unit A307
- 68 Belmont St Unit 68
- 13 Woodland St
- 52 Howard St
- 64 2nd St
- 7 Stevens Ct
- 19-21 Pleasant Terrace
- 826 Osgood St
- 68 Union St
- 80 Ferry St Unit 80A
- 357 Howard St Unit 361
- 75 Beverly St Unit 75
- 12 Walker Rd Unit 6
- 127 Marblehead St Unit A
- 317 Middlesex St
- 73 Riverview St Unit 75
- 75 Riverview St
- 71 Riverview St
- 55 Riverview St
- 67 Riverview St Unit 2
- 67 Riverview St Unit 1
- 67 Riverview St
- 47 Riverview St Unit 49
- 49 Riverview St Unit 2
- 41 Riverview St
- 37 Riverview St
- 33 Riverview St
- 31 Riverview St
- 27 Charles St
- 200 Sutton St Unit 412
- 200 Sutton St
- 288 Sutton St
- 11 Riverview St
- 220 Sutton St
- 220 Sutton St Unit 2