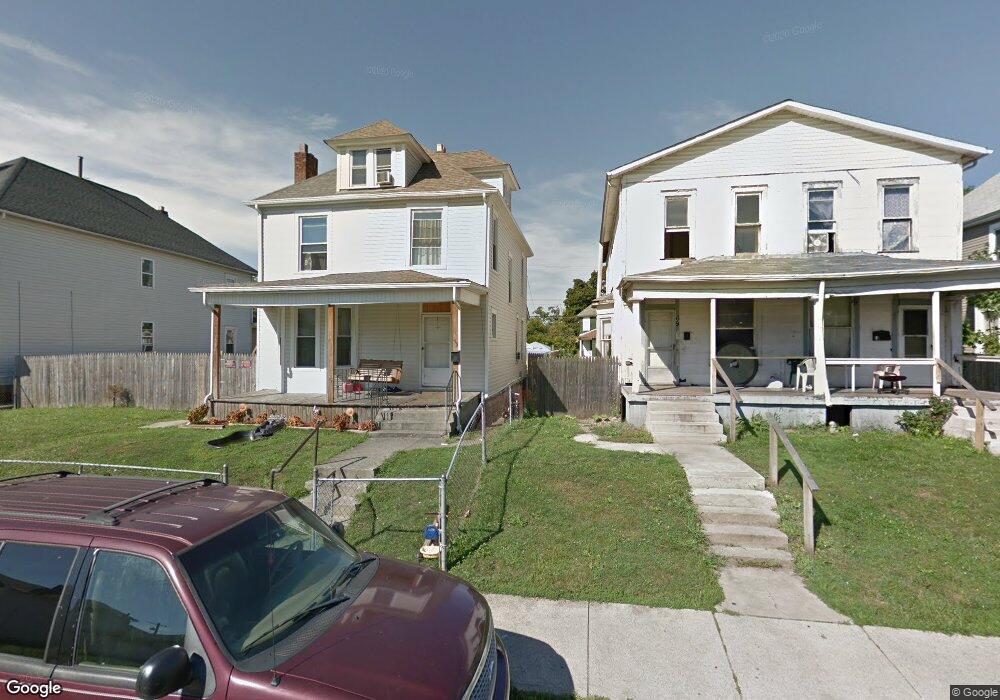
73 S Princeton Ave Columbus, OH 43222
Franklinton NeighborhoodEstimated Value: $185,000 - $237,000
4
Beds
1
Bath
1,590
Sq Ft
$133/Sq Ft
Est. Value
About This Home
This home is located at 73 S Princeton Ave, Columbus, OH 43222 and is currently estimated at $211,436, approximately $132 per square foot. 73 S Princeton Ave is a home located in Franklin County with nearby schools including Starling PK-8, West High School, and Central High School.
Ownership History
Date
Name
Owned For
Owner Type
Purchase Details
Closed on
Sep 24, 2009
Sold by
Wills Steven G and Stockel Wills Andrea M
Bought by
Wills Steven G and Stockel Wills Andrea M
Current Estimated Value
Purchase Details
Closed on
Feb 2, 1988
Bought by
Wills Steven G Tr
Purchase Details
Closed on
Jul 1, 1986
Create a Home Valuation Report for This Property
The Home Valuation Report is an in-depth analysis detailing your home's value as well as a comparison with similar homes in the area
Home Values in the Area
Average Home Value in this Area
Purchase History
| Date | Buyer | Sale Price | Title Company |
|---|---|---|---|
| Wills Steven G | -- | Attorney | |
| Wills Steven G Tr | $11,000 | -- | |
| -- | $16,800 | -- |
Source: Public Records
Tax History Compared to Growth
Tax History
| Year | Tax Paid | Tax Assessment Tax Assessment Total Assessment is a certain percentage of the fair market value that is determined by local assessors to be the total taxable value of land and additions on the property. | Land | Improvement |
|---|---|---|---|---|
| 2024 | $2,995 | $65,350 | $8,050 | $57,300 |
| 2023 | $2,957 | $65,345 | $8,050 | $57,295 |
| 2022 | $817 | $15,370 | $2,170 | $13,200 |
| 2021 | $818 | $15,370 | $2,170 | $13,200 |
| 2020 | $819 | $15,370 | $2,170 | $13,200 |
| 2019 | $797 | $12,810 | $1,820 | $10,990 |
| 2018 | $837 | $12,810 | $1,820 | $10,990 |
| 2017 | $796 | $12,810 | $1,820 | $10,990 |
| 2016 | $961 | $13,410 | $2,140 | $11,270 |
| 2015 | $879 | $13,410 | $2,140 | $11,270 |
| 2014 | $788 | $12,710 | $1,440 | $11,270 |
| 2013 | $432 | $14,105 | $1,575 | $12,530 |
Source: Public Records
Map
Nearby Homes
- 33 S Princeton Ave
- 79-81 Dana Ave
- 82 N Princeton Ave
- 87 S Princeton Ave
- 54-56 Brehl Ave
- 116 W Park Ave
- 37-39 S Yale Ave
- 49 S Yale Ave
- 55 Brehl Ave
- 117 Dana Ave
- 119 Dana Ave
- 69-69.5 Chicago Ave
- 143 S Princeton Ave
- 144 S Princeton Ave
- 63 Hayden Ave
- 146 Brehl Ave
- 148 W Park Ave
- 73 Hayden Ave
- 173 Brehl Ave
- 205 S Princeton Ave
- 77 S Princeton Ave Unit 79
- 73 N Princeton Ave
- 67 S Princeton Ave Unit 69
- 81 S Princeton Ave Unit 83
- 81-83 S Princeton Ave
- 89 S Princeton Ave
- 63 S Princeton Ave Unit 65
- 63-65 N Princeton Ave
- 59 N Princeton Ave Unit 61
- 59 S Princeton Ave
- 91 S Princeton Ave
- 1304 W State St
- 82 Dana Ave Unit 84
- 82 Dana Ave
- 82-84 Dana Ave
- 82 N Princeton Ave
- 78 S Princeton Ave
- 70 Dana Ave Unit 72
- 70 Dana Ave Unit 2
- 70-72 Dana Ave