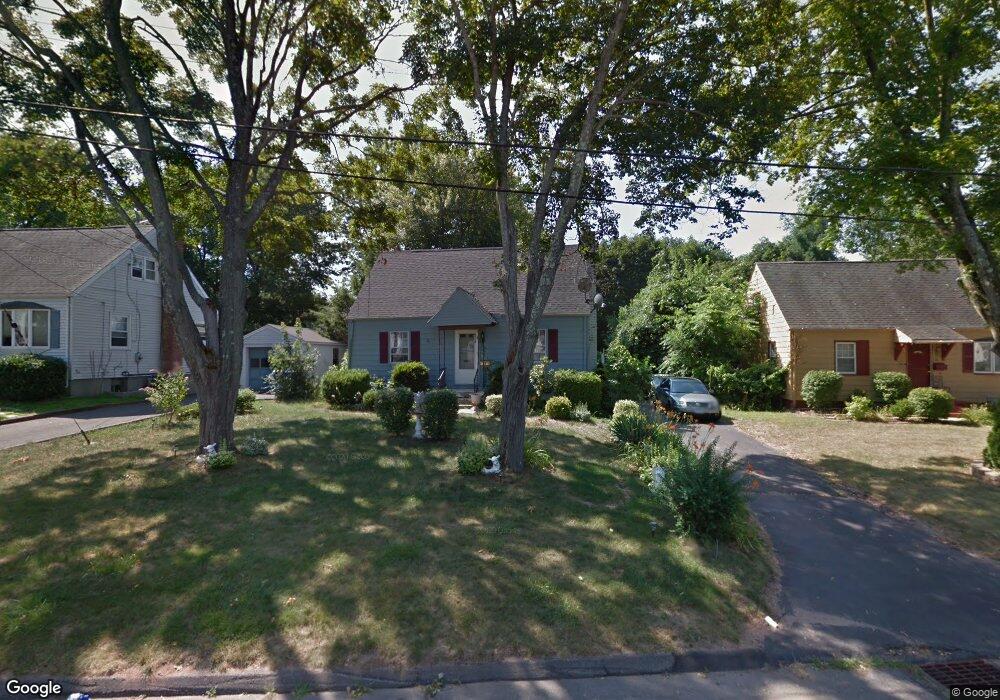
73 Salem Rd East Hartford, CT 06118
Estimated Value: $285,675 - $317,000
3
Beds
1
Bath
1,302
Sq Ft
$230/Sq Ft
Est. Value
About This Home
This home is located at 73 Salem Rd, East Hartford, CT 06118 and is currently estimated at $299,419, approximately $229 per square foot. 73 Salem Rd is a home located in Hartford County with nearby schools including Joseph O. Goodwin School, East Hartford Middle School, and East Hartford High School.
Ownership History
Date
Name
Owned For
Owner Type
Purchase Details
Closed on
Sep 29, 2021
Sold by
Fabian Jose F
Bought by
Fabian Nannette A
Current Estimated Value
Purchase Details
Closed on
Jun 25, 1998
Sold by
Fauteux Urdian A
Bought by
Faxrian Jose F and Barreto Nannette A
Home Financials for this Owner
Home Financials are based on the most recent Mortgage that was taken out on this home.
Original Mortgage
$88,050
Interest Rate
7.09%
Mortgage Type
Unknown
Create a Home Valuation Report for This Property
The Home Valuation Report is an in-depth analysis detailing your home's value as well as a comparison with similar homes in the area
Home Values in the Area
Average Home Value in this Area
Purchase History
| Date | Buyer | Sale Price | Title Company |
|---|---|---|---|
| Fabian Nannette A | -- | None Available | |
| Faxrian Jose F | $88,000 | -- |
Source: Public Records
Mortgage History
| Date | Status | Borrower | Loan Amount |
|---|---|---|---|
| Previous Owner | Faxrian Jose F | $171,000 | |
| Previous Owner | Faxrian Jose F | $144,320 | |
| Previous Owner | Faxrian Jose F | $89,200 | |
| Previous Owner | Faxrian Jose F | $88,050 |
Source: Public Records
Tax History Compared to Growth
Tax History
| Year | Tax Paid | Tax Assessment Tax Assessment Total Assessment is a certain percentage of the fair market value that is determined by local assessors to be the total taxable value of land and additions on the property. | Land | Improvement |
|---|---|---|---|---|
| 2025 | $5,855 | $127,570 | $38,670 | $88,900 |
| 2024 | $5,613 | $127,570 | $38,670 | $88,900 |
| 2023 | $5,427 | $127,570 | $38,670 | $88,900 |
| 2022 | $5,230 | $127,570 | $38,670 | $88,900 |
| 2021 | $4,548 | $92,160 | $29,300 | $62,860 |
| 2020 | $4,601 | $92,160 | $29,300 | $62,860 |
| 2019 | $4,526 | $92,160 | $29,300 | $62,860 |
| 2018 | $4,392 | $92,160 | $29,300 | $62,860 |
| 2017 | $4,336 | $92,160 | $29,300 | $62,860 |
| 2016 | $4,328 | $94,380 | $29,300 | $65,080 |
| 2015 | $4,328 | $94,380 | $29,300 | $65,080 |
| 2014 | $4,285 | $94,380 | $29,300 | $65,080 |
Source: Public Records
Map
Nearby Homes