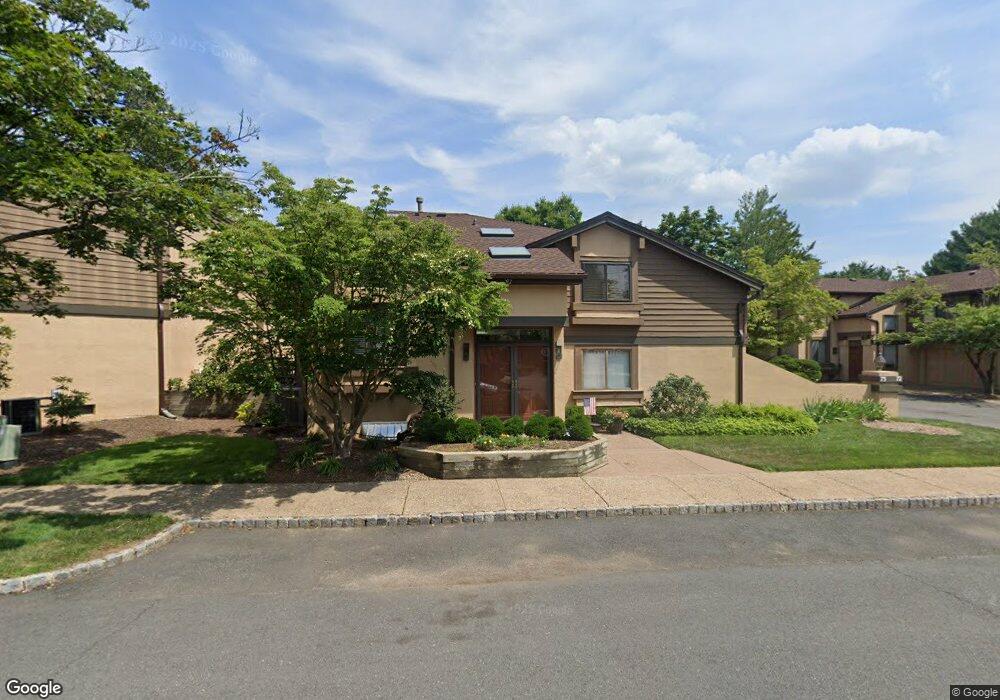
73 Sayre Dr Princeton, NJ 08540
Estimated Value: $682,289 - $786,000
2
Beds
3
Baths
1,650
Sq Ft
$439/Sq Ft
Est. Value
About This Home
This home is located at 73 Sayre Dr, Princeton, NJ 08540 and is currently estimated at $724,572, approximately $439 per square foot. 73 Sayre Dr is a home located in Middlesex County with nearby schools including Town Center Elementary School, Millstone River School, and Thomas R. Grover Middle School.
Ownership History
Date
Name
Owned For
Owner Type
Purchase Details
Closed on
Mar 30, 2015
Sold by
Bardwell J Stuart and Bardwell Hillary M
Bought by
Pflugfelder Roger F and Pflugfelder Linda Y
Current Estimated Value
Purchase Details
Closed on
Jul 5, 2000
Sold by
Giroux Susan
Bought by
Shah Sandip
Home Financials for this Owner
Home Financials are based on the most recent Mortgage that was taken out on this home.
Original Mortgage
$217,405
Interest Rate
8.07%
Purchase Details
Closed on
Aug 9, 1995
Sold by
Ring Ellen
Bought by
Giroux Susan
Create a Home Valuation Report for This Property
The Home Valuation Report is an in-depth analysis detailing your home's value as well as a comparison with similar homes in the area
Home Values in the Area
Average Home Value in this Area
Purchase History
| Date | Buyer | Sale Price | Title Company |
|---|---|---|---|
| Pflugfelder Roger F | $444,000 | First American Title Ins Co | |
| Shah Sandip | $228,900 | -- | |
| Giroux Susan | $164,935 | -- |
Source: Public Records
Mortgage History
| Date | Status | Borrower | Loan Amount |
|---|---|---|---|
| Previous Owner | Shah Sandip | $217,405 |
Source: Public Records
Tax History Compared to Growth
Tax History
| Year | Tax Paid | Tax Assessment Tax Assessment Total Assessment is a certain percentage of the fair market value that is determined by local assessors to be the total taxable value of land and additions on the property. | Land | Improvement |
|---|---|---|---|---|
| 2025 | $10,539 | $412,900 | $125,000 | $287,900 |
| 2024 | $10,279 | $412,900 | $125,000 | $287,900 |
| 2023 | $10,279 | $412,900 | $125,000 | $287,900 |
| 2022 | $10,118 | $412,900 | $125,000 | $287,900 |
| 2021 | $9,209 | $396,900 | $125,000 | $271,900 |
| 2020 | $9,417 | $393,700 | $125,000 | $268,700 |
| 2019 | $9,209 | $393,700 | $125,000 | $268,700 |
| 2018 | $9,004 | $393,700 | $125,000 | $268,700 |
| 2017 | $8,748 | $393,700 | $125,000 | $268,700 |
| 2016 | $8,362 | $393,700 | $125,000 | $268,700 |
| 2015 | $9,197 | $364,400 | $140,000 | $224,400 |
| 2014 | -- | $364,400 | $140,000 | $224,400 |
Source: Public Records
Map
Nearby Homes