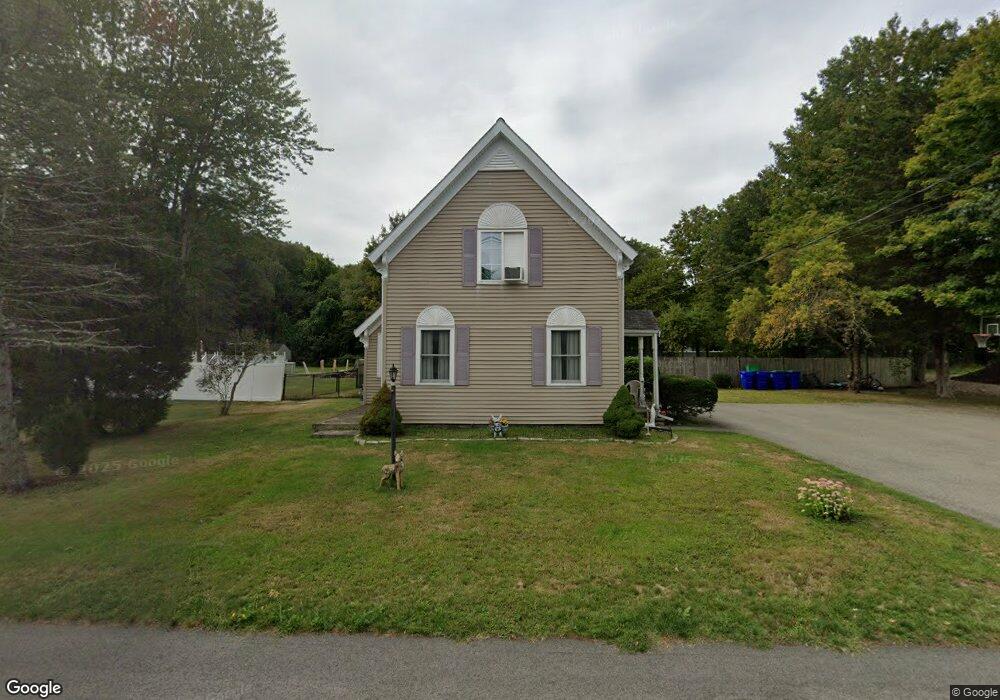
73 Spring St Rockland, MA 02370
Estimated Value: $570,000 - $683,000
3
Beds
2
Baths
1,952
Sq Ft
$309/Sq Ft
Est. Value
About This Home
This home is located at 73 Spring St, Rockland, MA 02370 and is currently estimated at $603,098, approximately $308 per square foot. 73 Spring St is a home located in Plymouth County with nearby schools including Rockland Senior High School, Calvary Chapel Academy, and St Bridget School.
Ownership History
Date
Name
Owned For
Owner Type
Purchase Details
Closed on
Dec 10, 1993
Sold by
Esposito Cecilia J
Bought by
Hite Gary F and Hite Mary T
Current Estimated Value
Home Financials for this Owner
Home Financials are based on the most recent Mortgage that was taken out on this home.
Original Mortgage
$109,600
Interest Rate
6.78%
Mortgage Type
Purchase Money Mortgage
Create a Home Valuation Report for This Property
The Home Valuation Report is an in-depth analysis detailing your home's value as well as a comparison with similar homes in the area
Home Values in the Area
Average Home Value in this Area
Purchase History
| Date | Buyer | Sale Price | Title Company |
|---|---|---|---|
| Hite Gary F | $137,000 | -- |
Source: Public Records
Mortgage History
| Date | Status | Borrower | Loan Amount |
|---|---|---|---|
| Open | Hite Gary F | $150,000 | |
| Closed | Hite Gary F | $109,600 | |
| Previous Owner | Hite Gary F | $10,000 |
Source: Public Records
Tax History
| Year | Tax Paid | Tax Assessment Tax Assessment Total Assessment is a certain percentage of the fair market value that is determined by local assessors to be the total taxable value of land and additions on the property. | Land | Improvement |
|---|---|---|---|---|
| 2025 | $6,665 | $487,600 | $222,100 | $265,500 |
| 2024 | $6,469 | $460,100 | $209,500 | $250,600 |
| 2023 | $6,583 | $432,500 | $202,300 | $230,200 |
| 2022 | $6,305 | $376,400 | $175,900 | $200,500 |
| 2021 | $5,770 | $333,900 | $159,900 | $174,000 |
| 2020 | $5,567 | $318,100 | $152,300 | $165,800 |
| 2019 | $5,243 | $292,600 | $145,100 | $147,500 |
| 2018 | $363 | $275,300 | $145,100 | $130,200 |
| 2017 | $4,873 | $263,700 | $145,100 | $118,600 |
| 2016 | $4,905 | $265,300 | $139,500 | $125,800 |
| 2015 | $4,917 | $258,400 | $130,400 | $128,000 |
| 2014 | $4,647 | $253,400 | $127,900 | $125,500 |
Source: Public Records
Map
Nearby Homes
- 215 Market St
- 225 W Water St
- 5 Pat Rose Way
- 9 Pat Rose Way
- 8 Pat Rose Way
- 103 Grove St Unit 349
- 103 Grove St Unit 317
- 135 Grove St Unit 115
- 135 Grove St Unit 110
- 135 Grove St Unit 133
- 119 Grove St Unit 238
- 119 Grove St Unit 223
- 12 Linden St
- 50 Linden Park
- 7 Carlys Way
- 810 Brookline Way
- 92 Liberty St
- 49 Liberty St
- 9 Old Market St
- 117 Liberty St
Your Personal Tour Guide
Ask me questions while you tour the home.