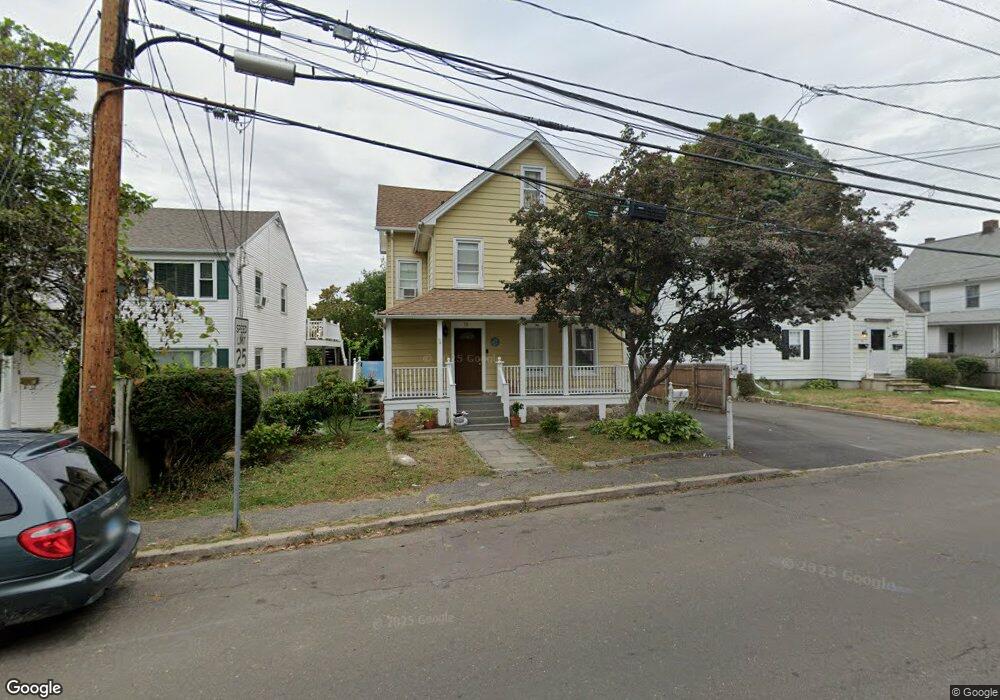
73 Stuart Ave Norwalk, CT 06850
Spring Hill NeighborhoodEstimated Value: $764,000 - $836,000
3
Beds
4
Baths
1,986
Sq Ft
$395/Sq Ft
Est. Value
About This Home
This home is located at 73 Stuart Ave, Norwalk, CT 06850 and is currently estimated at $784,975, approximately $395 per square foot. 73 Stuart Ave is a home located in Fairfield County with nearby schools including Jefferson Marine Science Elementary School, Ponus Ridge Middle School, and Brien Mcmahon High School.
Ownership History
Date
Name
Owned For
Owner Type
Purchase Details
Closed on
Feb 15, 2005
Sold by
Recinos Dilman and Palma Luis A
Bought by
Rojas Ana and Condori Hector
Current Estimated Value
Home Financials for this Owner
Home Financials are based on the most recent Mortgage that was taken out on this home.
Original Mortgage
$436,000
Outstanding Balance
$226,983
Interest Rate
6.12%
Estimated Equity
$557,992
Purchase Details
Closed on
Jan 17, 2003
Sold by
Paredes Trinidad
Bought by
Recinos Dilman and Palma Luis A
Purchase Details
Closed on
Jun 8, 2000
Sold by
Torres Romeo and Torres Carmen
Bought by
Ortega Trinidad
Purchase Details
Closed on
Dec 3, 1993
Sold by
Cohn Jack and Cohn Joan
Bought by
Torres Carmen and Torres Romeo
Create a Home Valuation Report for This Property
The Home Valuation Report is an in-depth analysis detailing your home's value as well as a comparison with similar homes in the area
Home Values in the Area
Average Home Value in this Area
Purchase History
| Date | Buyer | Sale Price | Title Company |
|---|---|---|---|
| Rojas Ana | $545,000 | -- | |
| Rojas Ana | $545,000 | -- | |
| Recinos Dilman | $415,000 | -- | |
| Recinos Dilman | $415,000 | -- | |
| Ortega Trinidad | $210,000 | -- | |
| Ortega Trinidad | $210,000 | -- | |
| Torres Carmen | $147,600 | -- | |
| Torres Carmen | $147,600 | -- |
Source: Public Records
Mortgage History
| Date | Status | Borrower | Loan Amount |
|---|---|---|---|
| Open | Torres Carmen | $436,000 | |
| Closed | Torres Carmen | $109,000 |
Source: Public Records
Tax History
| Year | Tax Paid | Tax Assessment Tax Assessment Total Assessment is a certain percentage of the fair market value that is determined by local assessors to be the total taxable value of land and additions on the property. | Land | Improvement |
|---|---|---|---|---|
| 2025 | $9,199 | $384,880 | $141,450 | $243,430 |
| 2024 | $9,062 | $384,880 | $141,450 | $243,430 |
| 2023 | $5,934 | $236,540 | $111,140 | $125,400 |
| 2022 | $5,806 | $236,540 | $111,140 | $125,400 |
| 2021 | $5,670 | $236,540 | $111,140 | $125,400 |
| 2020 | $5,667 | $236,540 | $111,140 | $125,400 |
| 2019 | $5,515 | $236,540 | $111,140 | $125,400 |
| 2018 | $5,555 | $208,810 | $121,800 | $87,010 |
| 2017 | $5,363 | $208,810 | $121,800 | $87,010 |
| 2016 | $5,312 | $208,810 | $121,800 | $87,010 |
| 2015 | $5,298 | $208,810 | $121,800 | $87,010 |
| 2014 | $5,229 | $208,810 | $121,800 | $87,010 |
Source: Public Records
Map
Nearby Homes
- 9 Frost St
- 42 Stuart Ave Unit A1
- 50 Fairview Ave Unit 2D
- 2 Finley St
- 33 Glenwood Ave Unit 1
- 4 Truman Ct
- 34 Ferris Ave Unit A2
- 8 Elmcrest Terrace Unit 103
- 14 Ferris Ave Unit 9
- 12 Sention Ave
- 26 Prospect Ave Unit F4
- 29 Van Buren Ave Unit I3
- 18 Prospect Ave Unit B1
- 2 Dover St Unit 5
- 11 Bedford Ave Unit J2
- 11 Bedford Ave Unit 1
- 2 Coldspring St
- 16 Grandview Ave
- 75 N Taylor Ave
- 2 Leuvine St Unit 1
- 75 Stuart Ave
- 75 Stuart Ave Unit 2
- 71 Stuart Ave
- 2 Phillips St
- 77 Stuart Ave
- 69 Stuart Ave
- 69 Stuart Ave Unit 2
- 4 Phillips St
- 72 Stuart Ave
- 79 Stuart Ave
- 74 Stuart Ave
- 6 Phillips St
- 81 Stuart Ave
- 76 Stuart Ave
- 76 Stuart Ave Unit 1ST F
- 24 Hyatt Ave
- 24 Hyatt Ave Unit 1
- 7 Magnolia Ave
- 5 Magnolia Ave
- 67 Stuart Ave