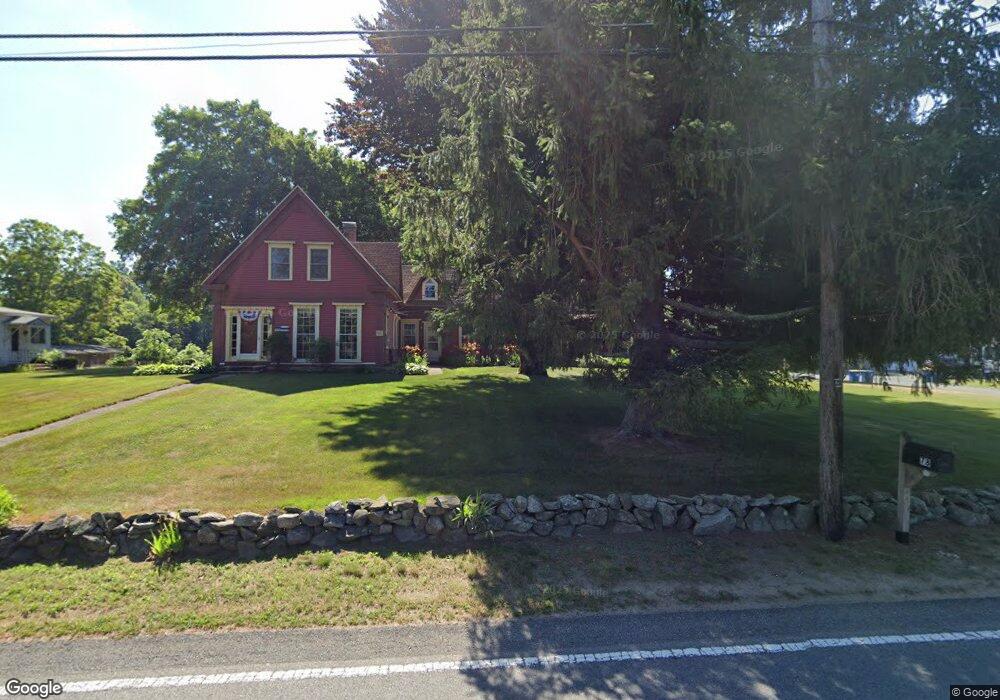
73 Summer St East Bridgewater, MA 02333
Estimated Value: $599,802 - $706,000
4
Beds
2
Baths
2,646
Sq Ft
$253/Sq Ft
Est. Value
About This Home
This home is located at 73 Summer St, East Bridgewater, MA 02333 and is currently estimated at $669,451, approximately $253 per square foot. 73 Summer St is a home located in Plymouth County with nearby schools including Gordon W Mitchell Middle School, East Bridgewater Jr./Sr. High School, and New Heights Charter School.
Ownership History
Date
Name
Owned For
Owner Type
Purchase Details
Closed on
Sep 29, 1992
Sold by
Stone Lester D
Bought by
Sparks Robt and Sparks Cynthia
Current Estimated Value
Create a Home Valuation Report for This Property
The Home Valuation Report is an in-depth analysis detailing your home's value as well as a comparison with similar homes in the area
Home Values in the Area
Average Home Value in this Area
Purchase History
| Date | Buyer | Sale Price | Title Company |
|---|---|---|---|
| Sparks Robt | $145,000 | -- |
Source: Public Records
Mortgage History
| Date | Status | Borrower | Loan Amount |
|---|---|---|---|
| Open | Sparks Robt | $56,000 | |
| Closed | Sparks Robt | $65,000 | |
| Open | Sparks Robt | $262,500 |
Source: Public Records
Tax History Compared to Growth
Tax History
| Year | Tax Paid | Tax Assessment Tax Assessment Total Assessment is a certain percentage of the fair market value that is determined by local assessors to be the total taxable value of land and additions on the property. | Land | Improvement |
|---|---|---|---|---|
| 2025 | $5,717 | $418,200 | $188,700 | $229,500 |
| 2024 | $5,717 | $413,100 | $181,400 | $231,700 |
| 2023 | $5,650 | $391,000 | $181,400 | $209,600 |
| 2022 | $5,795 | $371,500 | $165,000 | $206,500 |
| 2021 | $4,235 | $330,700 | $158,600 | $172,100 |
| 2020 | $5,668 | $327,800 | $152,500 | $175,300 |
| 2019 | $5,486 | $312,400 | $145,700 | $166,700 |
| 2018 | $2,110 | $306,000 | $145,700 | $160,300 |
| 2017 | $5,391 | $294,600 | $139,000 | $155,600 |
| 2016 | $5,252 | $289,200 | $139,000 | $150,200 |
| 2015 | $5,113 | $287,900 | $138,000 | $149,900 |
| 2014 | $5,006 | $288,200 | $135,100 | $153,100 |
Source: Public Records
Map
Nearby Homes