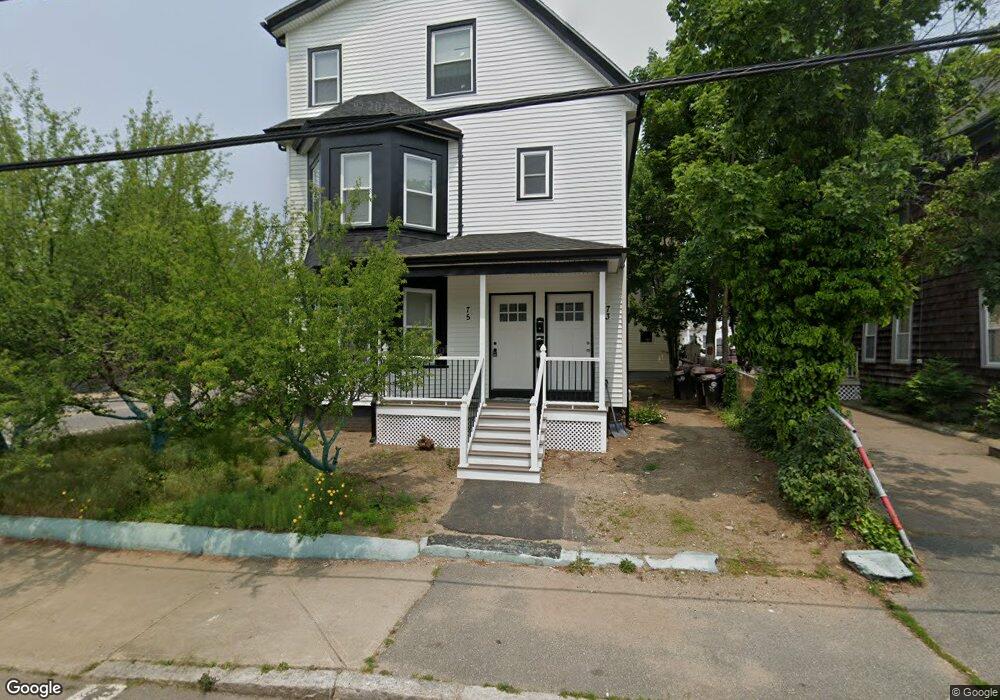
73 Tremont St Brockton, MA 02301
Clifton Heights NeighborhoodEstimated Value: $445,000 - $798,000
5
Beds
3
Baths
2,429
Sq Ft
$268/Sq Ft
Est. Value
About This Home
This home is located at 73 Tremont St, Brockton, MA 02301 and is currently estimated at $651,667, approximately $268 per square foot. 73 Tremont St is a home located in Plymouth County with nearby schools including Gilmore Elementary School, Davis K-8 School, and John F. Kennedy Elementary School.
Ownership History
Date
Name
Owned For
Owner Type
Purchase Details
Closed on
Dec 8, 1995
Sold by
Mechanics Coop Bk
Bought by
Orourke John E and Orourke Audrey L
Current Estimated Value
Purchase Details
Closed on
May 24, 1990
Sold by
Thibault Darren D
Bought by
Dupre Paul R
Create a Home Valuation Report for This Property
The Home Valuation Report is an in-depth analysis detailing your home's value as well as a comparison with similar homes in the area
Home Values in the Area
Average Home Value in this Area
Purchase History
| Date | Buyer | Sale Price | Title Company |
|---|---|---|---|
| Orourke John E | $80,000 | -- | |
| Orourke John E | $80,000 | -- | |
| Dupre Paul R | $165,000 | -- |
Source: Public Records
Mortgage History
| Date | Status | Borrower | Loan Amount |
|---|---|---|---|
| Open | Dupre Paul R | $315,000 | |
| Closed | Dupre Paul R | $216,000 | |
| Closed | Dupre Paul R | $173,000 |
Source: Public Records
Tax History Compared to Growth
Tax History
| Year | Tax Paid | Tax Assessment Tax Assessment Total Assessment is a certain percentage of the fair market value that is determined by local assessors to be the total taxable value of land and additions on the property. | Land | Improvement |
|---|---|---|---|---|
| 2025 | $7,185 | $593,300 | $130,500 | $462,800 |
| 2024 | $6,622 | $550,900 | $130,500 | $420,400 |
| 2023 | $6,020 | $463,800 | $98,900 | $364,900 |
| 2022 | $6,449 | $461,600 | $89,400 | $372,200 |
| 2021 | $5,427 | $374,300 | $73,500 | $300,800 |
| 2020 | $4,581 | $302,400 | $69,900 | $232,500 |
| 2019 | $4,412 | $283,900 | $66,500 | $217,400 |
| 2018 | $3,944 | $245,600 | $66,500 | $179,100 |
| 2017 | $3,764 | $233,800 | $66,500 | $167,300 |
| 2016 | $3,203 | $184,500 | $64,500 | $120,000 |
| 2015 | $2,855 | $157,300 | $64,500 | $92,800 |
| 2014 | $2,562 | $141,300 | $64,500 | $76,800 |
Source: Public Records
Map
Nearby Homes
- 67 Tremont St
- 1036 Warren Ave
- 1038 Warren Ave
- 65 Tremont St
- 74 Tremont St
- 85 Tremont St
- 1030 Warren Ave
- 63 Tremont St
- 63 Tremont St Unit 2
- 52 Tremont St
- 1035 Warren Ave
- 84 Tremont St
- 68 Tremont St
- 1022 Warren Ave
- 1022 Warren Ave Unit 1
- 1022 Warren Ave Unit 3
- 1072 Warren Ave
- 1024 Warren Ave
- 1027 Warren Ave
- 1027 Warren Ave Unit 3