
Seller's Agent in 2025
Emory Thompson
Emory Thompson Realty
(770) 601-0122
1 in this area
18 Total Sales
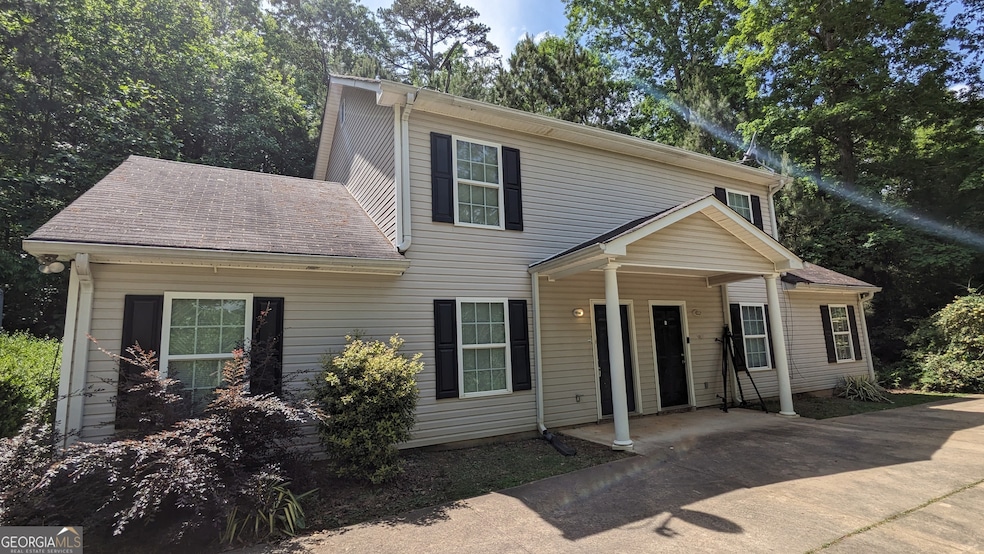
Unit A is vacant and has been partially updated. Unit B has been updated throughout and is rented at $1300 per month on a 2 year lease. Call Emory at 770-601-0122 for a showing appointment time. No appointment with showing time.
Last Agent to Sell the Property
Emory Thompson Realty License #278323 Listed on: 06/18/2025
| Date | Type | Sale Price | Title Company |
|---|---|---|---|
| Warranty Deed | $109,900 | -- | |
| Deed | -- | -- | |
| Deed | $163,000 | -- | |
| Deed | $157,000 | -- | |
| Deed | $88,000 | -- |
| Date | Status | Loan Amount | Loan Type |
|---|---|---|---|
| Previous Owner | $114,100 | New Conventional | |
| Previous Owner | $125,600 | New Conventional |
| Date | Event | Price | List to Sale | Price per Sq Ft |
|---|---|---|---|---|
| 07/31/2025 07/31/25 | Sold | $315,000 | 0.0% | -- |
| 06/24/2025 06/24/25 | Pending | -- | -- | -- |
| 06/18/2025 06/18/25 | For Sale | $315,000 | -- | -- |
| Year | Tax Paid | Tax Assessment Tax Assessment Total Assessment is a certain percentage of the fair market value that is determined by local assessors to be the total taxable value of land and additions on the property. | Land | Improvement |
|---|---|---|---|---|
| 2024 | $2,621 | $106,328 | $18,000 | $88,328 |
| 2023 | $2,607 | $106,328 | $18,000 | $88,328 |
| 2022 | $1,895 | $65,996 | $10,600 | $55,396 |
| 2021 | $1,865 | $61,446 | $10,600 | $50,846 |
| 2020 | $1,871 | $61,446 | $10,600 | $50,846 |
| 2019 | $1,700 | $54,725 | $10,600 | $44,125 |
| 2018 | $1,679 | $54,725 | $10,600 | $44,125 |
| 2017 | $1,377 | $47,285 | $10,600 | $36,685 |
| 2016 | $1,346 | $44,059 | $10,600 | $33,459 |
| 2015 | $1,364 | $44,422 | $10,600 | $33,822 |
| 2014 | $1,253 | $39,379 | $5,194 | $34,185 |
| 2013 | -- | $38,967 | $5,194 | $33,773 |
Seller's Agent in 2025
Emory Thompson
Emory Thompson Realty
(770) 601-0122
1 in this area
18 Total Sales
Buyer's Agent in 2025
Edwin Alfaro
Chapman Hall Realtors Professionals
(770) 313-3632
5 in this area
166 Total Sales
Source: Georgia MLS
MLS Number: 10546406
APN: XX090A-014
Disclaimer: Certain information contained herein is derived from information provided by parties other than Homes.com. All information provided is deemed reliable, but is not guaranteed to be accurate and should be independently verified.
![]() The data relating to real estate for sale on this web site comes in part from the Broker Reciprocity Program of Georgia MLS. Real estate listings held by brokerage firms other than Redfin are marked with the Broker Reciprocity logo and detailed information about them includes the name of the listing brokers. Information deemed reliable but not guaranteed. Copyright 2025 Georgia MLS. All rights reserved.
The data relating to real estate for sale on this web site comes in part from the Broker Reciprocity Program of Georgia MLS. Real estate listings held by brokerage firms other than Redfin are marked with the Broker Reciprocity logo and detailed information about them includes the name of the listing brokers. Information deemed reliable but not guaranteed. Copyright 2025 Georgia MLS. All rights reserved.