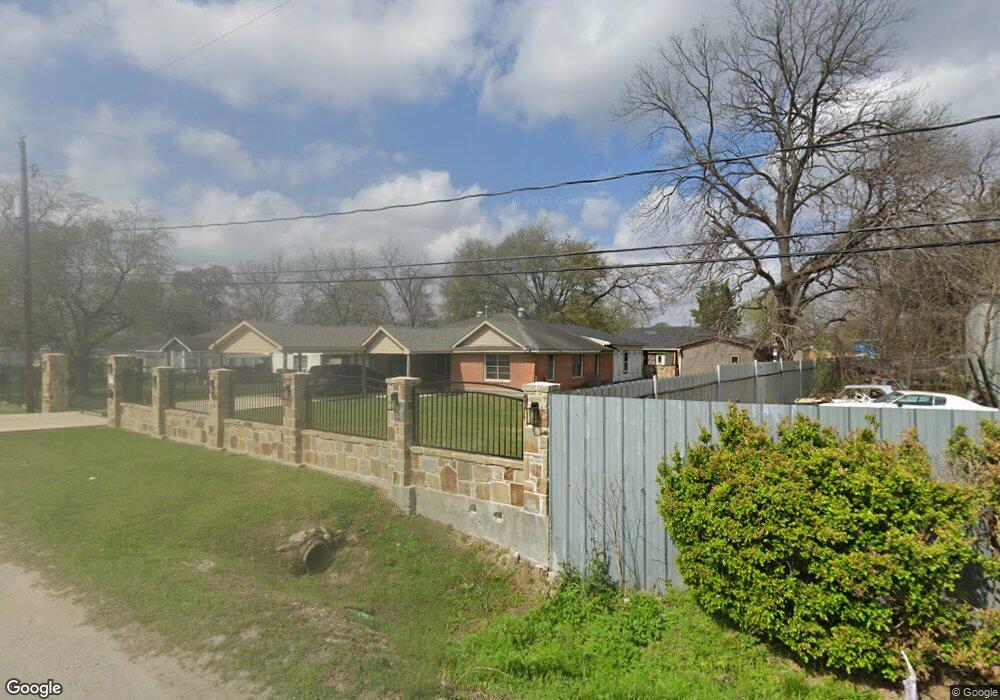
73 Veenstra St Houston, TX 77022
Northside-Northline NeighborhoodEstimated Value: $400,000 - $458,000
3
Beds
3
Baths
2,469
Sq Ft
$174/Sq Ft
Est. Value
About This Home
This home is located at 73 Veenstra St, Houston, TX 77022 and is currently estimated at $428,540, approximately $173 per square foot. 73 Veenstra St is a home located in Harris County with nearby schools including Burbank Elementary School, Burbank Middle School, and Sam Houston Math, Science & Technology Center.
Ownership History
Date
Name
Owned For
Owner Type
Purchase Details
Closed on
May 31, 2013
Sold by
Trevino Ruben and Trevino Belinda
Bought by
Rodriguez Corinne
Current Estimated Value
Home Financials for this Owner
Home Financials are based on the most recent Mortgage that was taken out on this home.
Original Mortgage
$98,188
Outstanding Balance
$70,248
Interest Rate
3.62%
Mortgage Type
FHA
Estimated Equity
$358,292
Purchase Details
Closed on
Sep 20, 1996
Sold by
Benavidez Irene Aguilar and Aguilar Paul
Bought by
Navarro Ildefonso S
Create a Home Valuation Report for This Property
The Home Valuation Report is an in-depth analysis detailing your home's value as well as a comparison with similar homes in the area
Home Values in the Area
Average Home Value in this Area
Purchase History
| Date | Buyer | Sale Price | Title Company |
|---|---|---|---|
| Rodriguez Corinne | -- | First American Title | |
| Navarro Ildefonso S | -- | -- |
Source: Public Records
Mortgage History
| Date | Status | Borrower | Loan Amount |
|---|---|---|---|
| Open | Rodriguez Corinne | $98,188 |
Source: Public Records
Tax History Compared to Growth
Tax History
| Year | Tax Paid | Tax Assessment Tax Assessment Total Assessment is a certain percentage of the fair market value that is determined by local assessors to be the total taxable value of land and additions on the property. | Land | Improvement |
|---|---|---|---|---|
| 2025 | $6,020 | $459,745 | $149,835 | $309,910 |
| 2024 | $6,020 | $459,745 | $149,835 | $309,910 |
| 2023 | $6,020 | $416,978 | $149,835 | $267,143 |
| 2022 | $5,207 | $242,732 | $114,160 | $128,572 |
| 2021 | $5,076 | $233,681 | $114,160 | $119,521 |
| 2020 | $5,477 | $280,577 | $114,160 | $166,417 |
| 2019 | $5,203 | $242,355 | $74,918 | $167,437 |
| 2018 | $2,750 | $150,000 | $74,918 | $75,082 |
| 2017 | $2,860 | $113,095 | $74,918 | $38,177 |
| 2016 | $2,807 | $111,003 | $74,918 | $36,085 |
| 2015 | $2,854 | $111,003 | $74,918 | $36,085 |
| 2014 | $2,854 | $111,003 | $74,918 | $36,085 |
Source: Public Records
Map
Nearby Homes
- 70 Burress St
- 90 Burress St Unit B
- 90 Burress St Unit A
- 9625 Fulton St
- 44 Farrell St
- 61 Trenwood Ln
- 108 Fichter St
- 91 Burbank St
- 110 Luetta St
- 108 Luetta St
- 106 Luetta St
- 104 Luetta St
- 45 Wellford St
- 216 Burress St
- 0 Burbank St Unit 9886770
- 202 Burbank St
- 56 Wellford St
- 249 De Boll St
- 253 De Boll St
- 9816 Fulton St